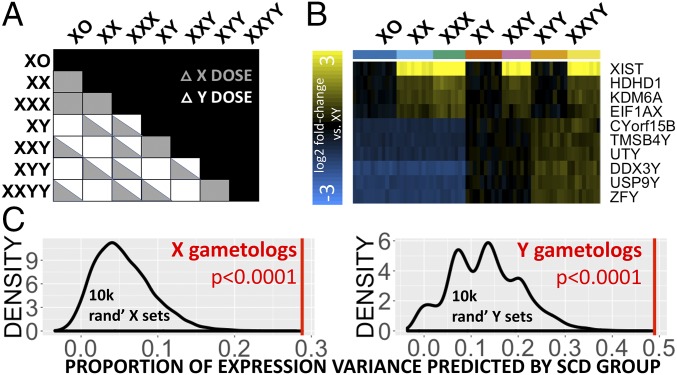
Fig. 1.
Consistent gene-expression changes with altered sex-chromosome dosage. (A) Cross-table showing all pairwise SCD group contrasts within the microarray dataset shaded by X- and/or Y-chromosome disparity. (B) Expression heatmap for the 10 genes that show DE across all contrasts involving disparity in X- or Y-chromosome count. The column color bar encodes SCD group membership for each sample. (C) Density plots showing the observed mean proportion of expression variance explained by SCD for 14 gametolog genes (red line) vs. null distribution (black line) of this variable for 10,000 randomly sampled sets of nongametolog sex-linked genes of equal size. Results are provided separately for X and Y chromosomes.

