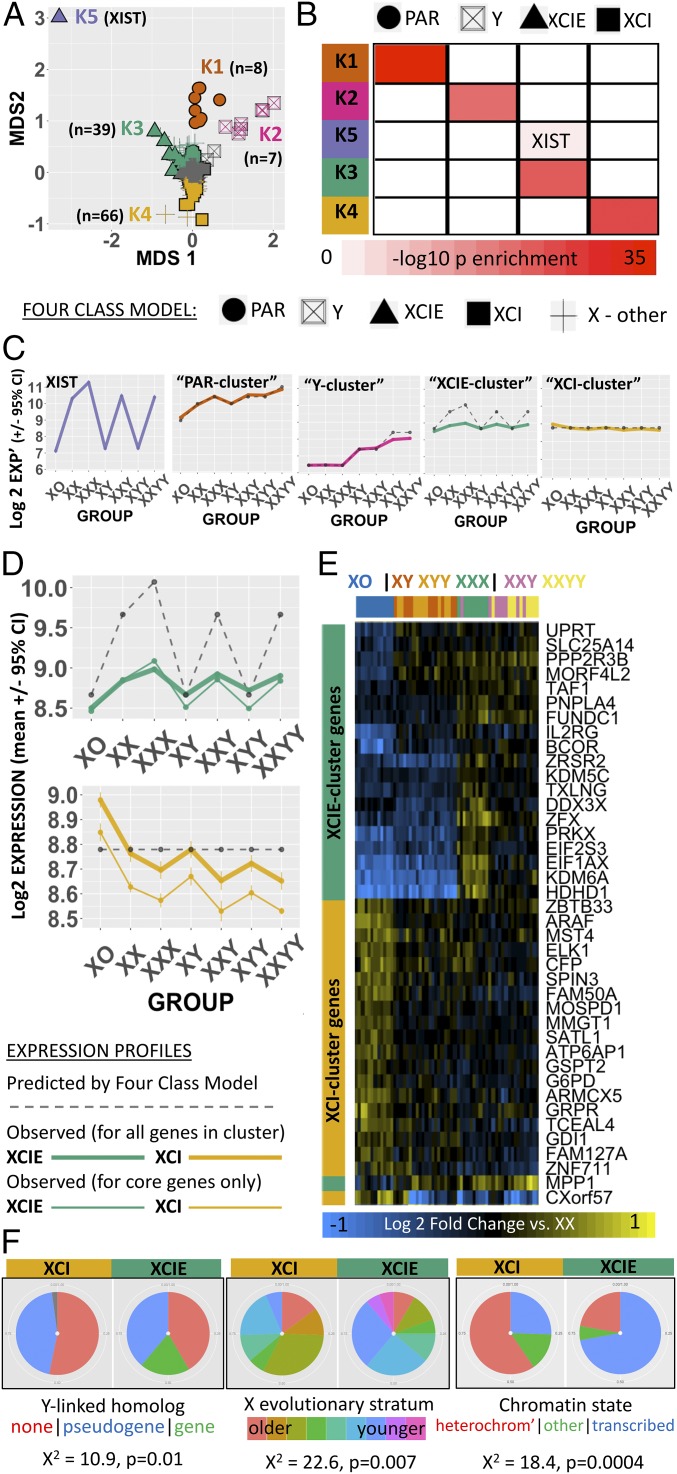
Fig. 2.
Data-driven partitioning of sex-chromosome genes by dosage sensitivity. (A) 2D multidimensional scaling (MDS) plot of sex-chromosome genes by their mean expression profiles across all seven SCD groups. Genes are coded by both the four-class model (shape) and k-means cluster grouping (color). MDS2 arranges X-linked genes along the established gradient of X-linked dosage sensitivity that ranges from extreme XCIE (XIST) to full XCI. A cluster of low/nonexpressed genes that lack SCD sensitivity is colored gray (SI Appendix, Text S4 and Fig. S2). (B) Cross-table showing enrichment of k-means clusters for four-class model gene groups. (C) Dot and line plots showing observed (solid colored) and predicted (dashed gray) mean expression for each k-means gene cluster across karyotype groups. (D) Close-up of observed (solid colored) vs. predicted (dashed gray) mean expression profiles of XCIE and XCI gene clusters. Observed expression profiles still counter predictions when analysis is restricted to core genes in each cluster with XCIE/XCI statuses that have been confirmed across three independent reports (thick colored line). (E) Heatmap showing normalized (vs. XX mean) expression of dosage-sensitive genes in the XCIE and XCI clusters (rows) for each sample (columns; the color bar encodes the SCD group). (F) Pie-charts showing that XCIE and XCI gene clusters from k-means display mirrored over/underrepresentation for three genomic features that have been linked to XCIE in prior research: (i) persistence of a surviving Y-linked homolog; (ii) location within younger evolutionary strata of the X chromosome; and (iii) presence of euchromatic vs. heterochromatic epigenetic markers.

