Fig. 3.
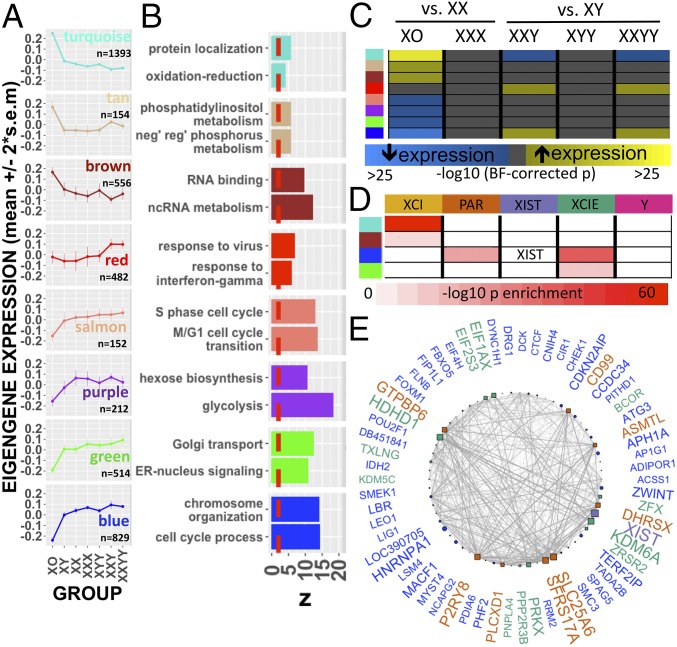
WGCNA of sex-chromosome dosage effects. (A) Dot and line plots detailing mean expression (± 95% CI) by SCD group for eight SCD-sensitive and functionally coherent gene-coexpression modules. (B) Top two GO term enrichments for each module exceeding the threshold for statistical significance (dashed red line). (C) Heatmap showing statistically significant DE of gene-coexpression modules between karyotype groups. (D) Cross-tabulation showing enrichment of Turquoise, Brown, Blue, and Green modules for the dosage-sensitive clusters of sex-chromosome genes detected by k-means. (E) Gene-coexpression network for the Blue module showing the top decile of coexpression relationships (edges) between the top decile of SCD-sensitive genes (nodes). Nodes are positioned in a circle for ease of visualization. Node shape distinguishes autosomal (circle) from sex-chromosome (square) genes. Sex-chromosome genes within the Blue module are colored according to their k-means cluster designation. Larger node and gene name sizes reflect greater SCD sensitivity. Edge width indexes the strength of coexpression between gene pairs.

