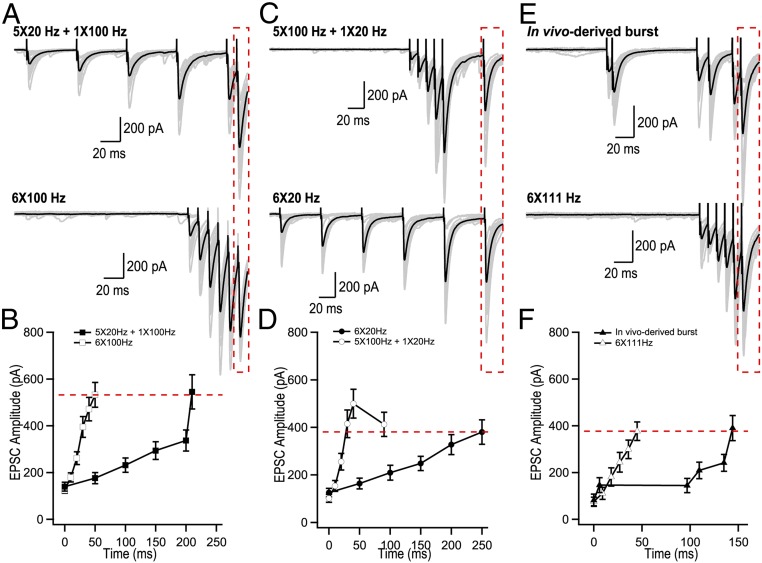
Fig. 2.
Glutamate release from MFB terminals operates through a counting logic. (A–F) Analysis of short-term facilitation at MFBs. (A, C, and E) Representative trains of EPSCs recorded using indicated stimulation paradigms. Gray traces, single trials; black traces, the averages of 20 trials. (B, D, and F) Summary graphs showing average EPSC amplitude as a function of time (n = 19 for 20 Hz; n = 15 for 5 × 20 Hz + 1 × 100 Hz; n = 25 for 100 Hz; n = 10 for 5 × 100 Hz+ 1 × 20 Hz; n = 9 for in-vivo–derived burst; n = 9 for 6 × 111 Hz).

