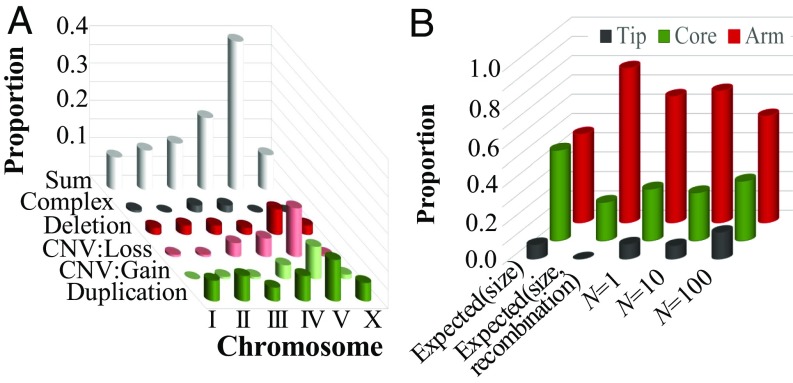
Fig. 3.
Genomic distribution of copy-number changes. CNV gains and losses refer to copy-number changes in preexisting duplications; duplications and deletions refer to copy-number changes of single-copy genes only. (A) The chromosomal distribution of spontaneous copy-number changes across all MA lines is significantly different from the expected distribution based on chromosomal length (G = 55.23, P = 5.01 × 10⁻⁷). Chromosome V harbors more spontaneous copy-number changes than expected by chance. (B) The expected and observed intrachromosomal distribution of spontaneous copy-number changes on chromosomal tips, cores, and arms in MA lines across different population sizes. The expected quantities are calculated from the proportion of the genome that is located in tips, cores, and arms. In addition, expected quantities were calculated from the product of the size and the recombination frequencies in different genomic regions. The observed distribution is significantly different from that expected based on size alone (G = 48.8; P = 2.55 × 10⁻¹¹) and when recombination frequency is taken into account (G = 420.5, P < 2.2 × 10⁻¹⁶).

