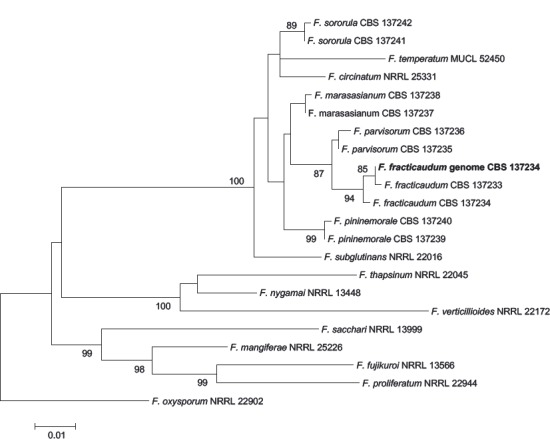
Fig. 8.

A Maximum Likelihood phylogeny showing the placement of the F. fracticaudum isolate (indicated in bold) that was sequenced in this study. The tree was inferred from combined β-tubulin and translation elongation factor 1-α gene sequences (Herron et al. 2015). Values at branch nodes are the bootstrapping confidence values with those ≥ 85% shown. The scale bar indicates substitution per site.
