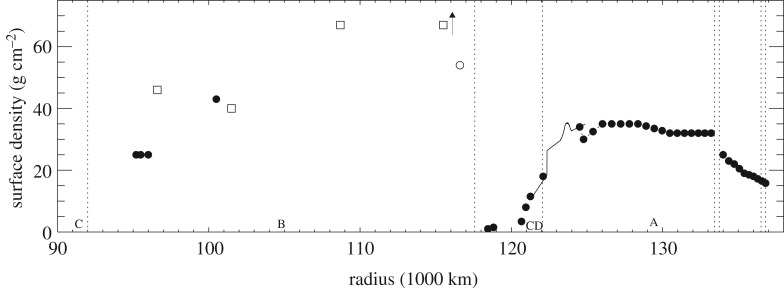
Figure 11.
Surface mass density profile including the B ring. The filled circles are derived from the wave model fits to wavelet signatures in [18]. The filled circles in the Cassini Division (CD) correspond to individual SDWs and SBWs, while the filled circles in the A ring correspond to regions fit collectively. The solid line corresponds to the Iapetus −1:0 SBW [17]. The open squares are data points from [24], and the arrow indicates a surface mass density measurement of approximately 130 g cm−2 from the same work. The open circle is a data point from Lissauer [43], as cited in [24]. Figure from Tiscareno & Harris [18].

