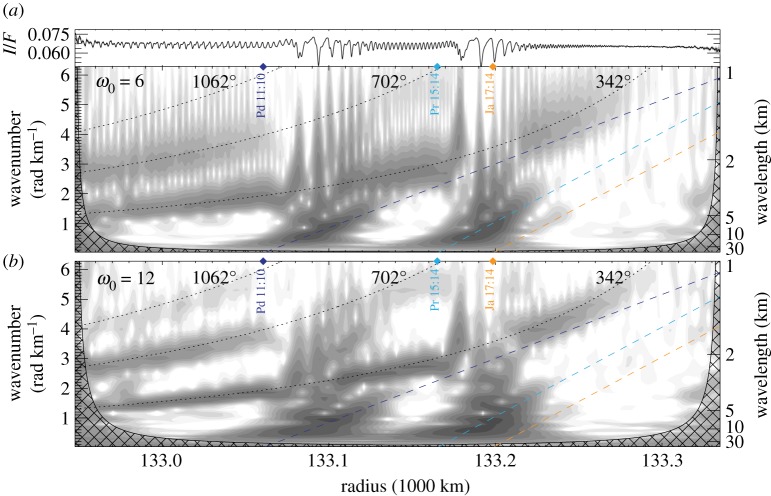
Figure 13.
Radial scan and two wavelet transforms from Cassini image N1467346329 (figure 12), showing wakes excited by Pan along with several density waves. (a) The wavelet plot, like all others in this paper, uses a central frequency ω0 = 6; (b) uses ω0 = 12, resulting in increased resolution in the spectral (y)-dimension at the expense of smearing in the radial (x)-dimension (see §3c). Density waves are clearer in (a), including the strong Pandora 11:10 and Prometheus 15:14 waves, but also the weak third-order Janus 17:14. Dashed lines indicate model density wave traces, assuming a background surface density σ0 = 40 g cm−2. Moonlet wakes excited by Pan are clearer in (b). The three dotted lines denote the frequency profiles [7] of wakes that have travelled 342°, 702° or 1062° in synodic longitude since their last encounters with Pan. Figure from Tiscareno et al. [11]. (Online version in colour.)

