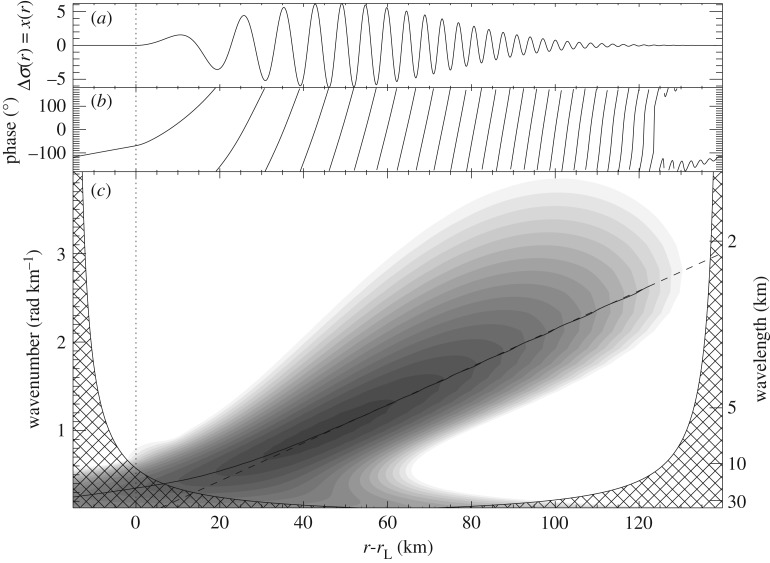
Figure 2.
(a) Synthetic density wave radial profile generated by equation (2.1) with the values of table 1, (b) wavelet phase and (c) wavelet energy. As with all wavelet plots in this paper, contours are logarithmic, with three contours to an order of magnitude, and the lowest contour level is at the square of the median error estimate for the scan (here we artificially set σ input = 0.1). The region filled with cross-hatching is the cone of influence. The dashed line is the foreknown wavenumber kDW(r) (equation (2.6)), while the solid line shows the calculated location of a wavelet ridge (equation (3.13)); here, the two diverge visibly only for r − rL < 40 km, corresponding to ξ < 6. Figure from Tiscareno et al. [11].

