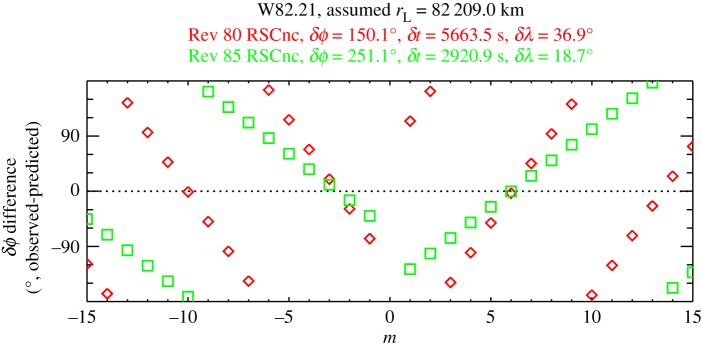
Figure 20.
Plot showing the difference between the observed and predicted values of δϕ between the ingress and egress cuts of the RS Cancri occultations for the wave W82.21 as a function of the assumed m-number, given the stipulated δλ and δt values. Different symbols correspond to different pairs of occultation cuts. Note that the residuals for both observations are close to zero when m = − 2, − 3 and +6, so these values of m are the ones most consistent with the observed phase differences. Figure from Hedman & Nicholson [4].

