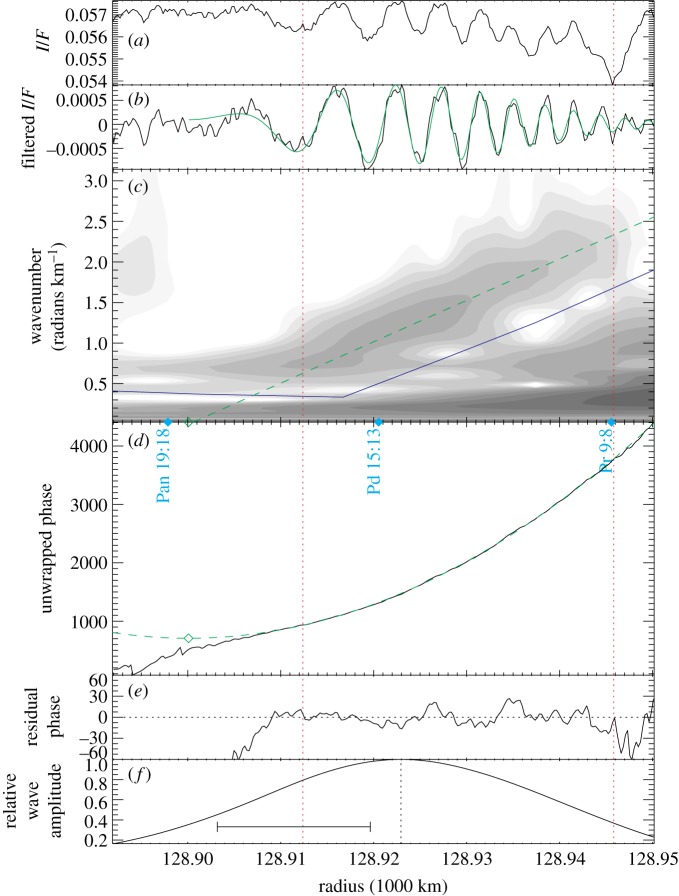
Figure 6.
The density wave fitting process, illustrated using the Pan 19:18 ILR density wave, observed in Cassini image N1467345975. The two red vertical dotted lines indicate the interval used for the quadratic fit. From top to bottom: (a) radial scan, (b) high-pass-filtered radial scan, with the final fitted wave shown in green, and (c) wavelet transform of radial scan, with the blue line indicating the filter boundary, and the green dashed line indicating the fitted wave's wavenumber. (d) Unwrapped wavelet phase, with the green dashed line indicating the quadratic fit and the green open diamond indicating the zero-derivative point. (e) Residual wavelet phase, showing that the interval used for the fit is the interval in which the phase behaves quadratically. (f) Wave amplitude, the local maximum of which (vertical dotted line) gives ξD; scale bar indicates the smoothing length of the boxcar filter. Figure from Tiscareno et al. [11].

