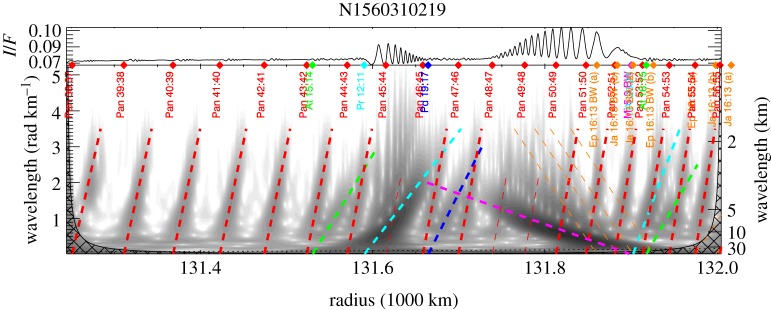
Figure 9.
Radial profile and wavelet plot for image N1560310219, continuing the example begun in figure 8. The radial profile extends across the top, and the greyscale shading in the main part of the plot indicates power in the wavelet transform (§4b). The signature of the Prometheus 12:11 SDW hangs downward from the associated cyan dashed line with a concave-up geometry [18], while the signature of the Mimas 5:3 SBW hews more closely to the associated magenta dashed line, because SBWs do not display significant nonlinearity. The ‘record grooves’ mentioned in figure 8 are here revealed to be weaker SDWs, mostly resonance with Pan (red) but some resonances with Atlas (green) and second-order resonances with Prometheus (cyan) and Pandora (dark blue). Wave models shown in bold are judged to appear in the data, while those shown as thin lines (e.g. Pan 49:48, the Janus/Epimetheus 16:13 bending waves) are not perceptible because they are overwritten by other, strong structures. All wave models in this figure use an unperturbed surface mass density σ0 = 32 g cm−2. Figure from Tiscareno & Harris [18].

