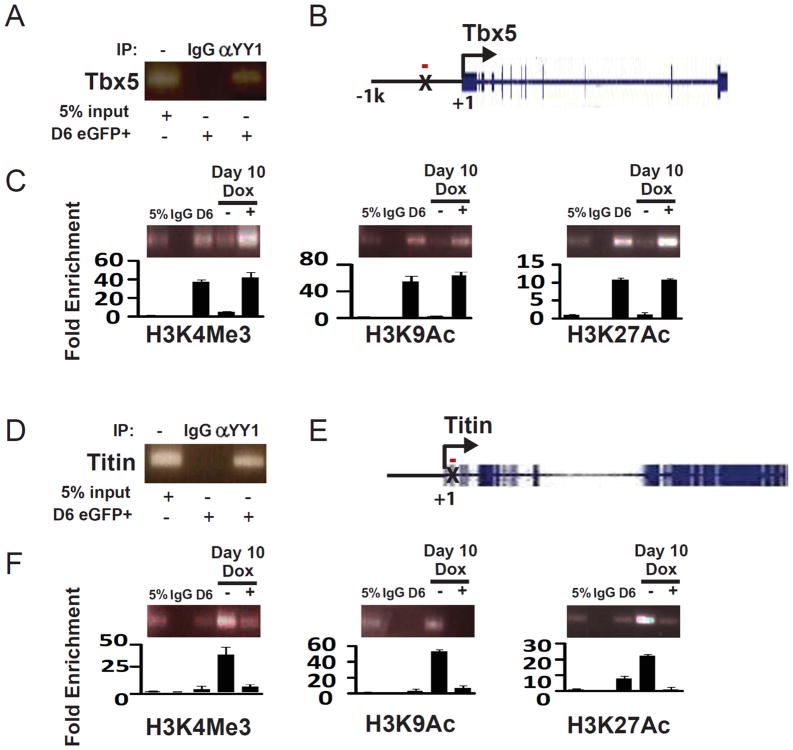
Figure 6.
Regulation of chromatin marks at the YY1 binding sites in the TBX5 and TITIN loci. (A) Confirmation of YY1 binding to the TBX5 locus in FACS-purified day 6 eGFP+ cells by anti-YY1 ChIP-PCR. (B) Diagram of the TBX5 locus. The YY1 binding site is indicated by X. The red bar represents the position of the amplicon for ChIP experiments. (C) Cells were in vitro differentiated and FACS-purified as described in Figure 2A. ChIP experiments were performed using antibodies against H3K9Ac, K3K27Ac, and H3K4Me3 and IgG as a negative control. The difference in chromatin marks at the YY1 binding site with or without YY1 overexpression was quantitated by real-time PCR. (D) Confirmation of YY1 binding to the TITIN locus in FACS-purified day 6 eGFP+ cells by anti-YY1 ChIP. (E) Diagram of the TITIN locus. The YY1 binding site is indicated by X. The red bar represents the position of the amplicon for ChIP experiments. (F) Cells were in vitro differentiated and FACS-purified as described in Figure 2A. ChIP experiments were performed using antibodies against H3K9Ac, K3K27Ac, and K3K4Me3 and IgG as a negative control. The difference in chromatin marks at the YY1 binding site with or without YY1 overexpression was quantitated by real-time PCR.

