
Figure 1. apoEVs promote growth of GBM cells in vitro and in vivo.
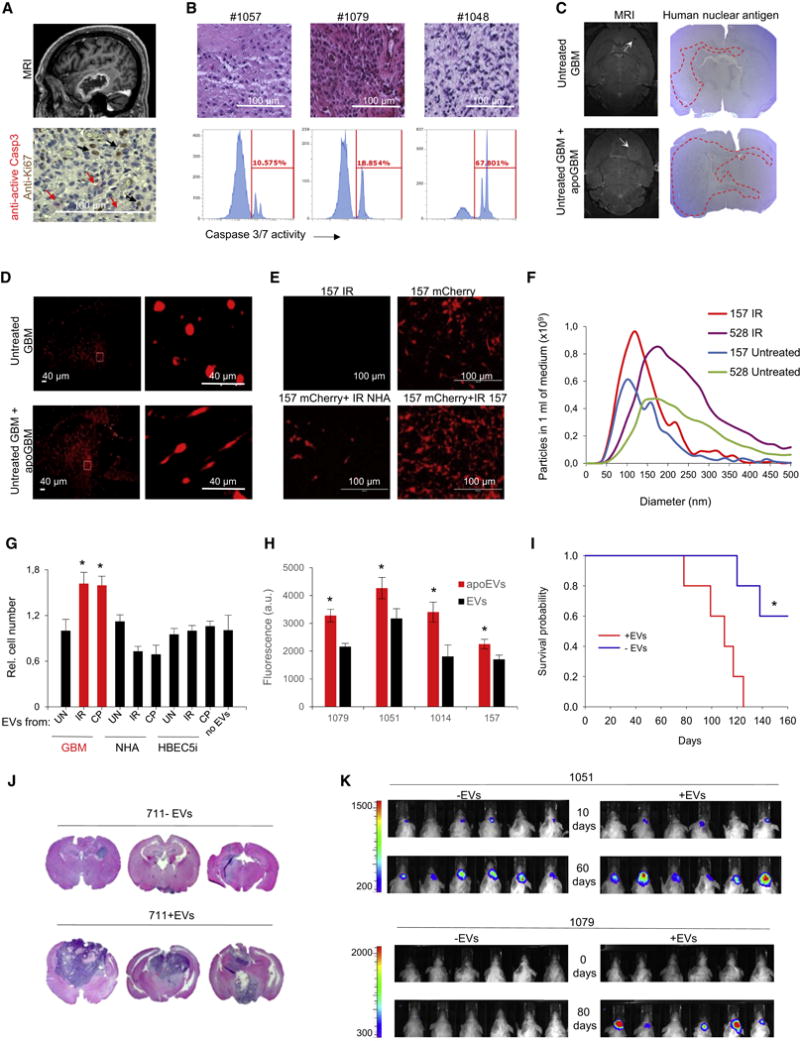
(A) MRI image of GBM tumor (top) and section of patient GBM stained for active Caspase 3 and Ki67 (bottom).
(B) H&E staining of sections from three representative GBM (top) and flow cytometry analysis of caspase 3/7 activity in freshly dissociated corresponding tumors (bottom).
(C) Representative MRI images and mouse brain sections stained for human nuclear antigen after intracranial transplantation of untreated glioma spheres (GBM1027 for MRI and GBM157 for brain sections) alone or together with lethally irradiated (12 Gy) spheres, ratio 1:1 (n = 5 mice per group).
(D) Representative images of mouse brain sections obtained as in “C” and stained for human Nestin.
(E) Co-culture of mCherry labeled GBM157 cells with unlabeled lethally irradiated normal human atrocities (NHA) or GBM157 cells (ratio 1:1).
(F) Nanoparticle tracking analysis of EVs produced by untreated or lethally irradiated GBM157 and GBM528 cells.
(G) In vitro cell growth assay of GBM157 spheres cultivated for 7 days with EVs from different sources: GBM157 spheres, normal human astrocytes (NHA) or immortalized brain endothelial cells (HBEC5i) that were left untreated (UN), lethally irradiated (IR) or treated with 50 μM of cisplatin (CP).
(H) In vitro cell growth assay of GBM157, GBM1079, GBM1051 and GBM1014 spheres cultivated for 7 days with EVs from lethally irradiated (apoEVs) or untreated (EVs) corresponding cells.
(I) Kaplan-Meier survival curves of mice injected with GBM711 spheres along or together with apoEVs (n = 5 mice per group, p<0.01, log-rank test).
(J) Representative images of H&E stained mouse brain sections after intracranial transplantation of GBM711 spheres alone or together with apoEVs from 711 cells (n= 5 mice per group).
(K) Representative bioluminescence images of mice intracranially injected with 2·105 luciferase labeled GBM1051 (upper panel) or GBM1079 (lower panel) neurospheres in the presence or absence of apoEVs produced by unlabeled lethally irradiated (12 Gy) cells from the same cells.
All quantitative data are average ± SD; *p < 0.01; See also Figures S1 and S2.