
Figure 2. apoEVs promote more aggressive phenotype of GBM.
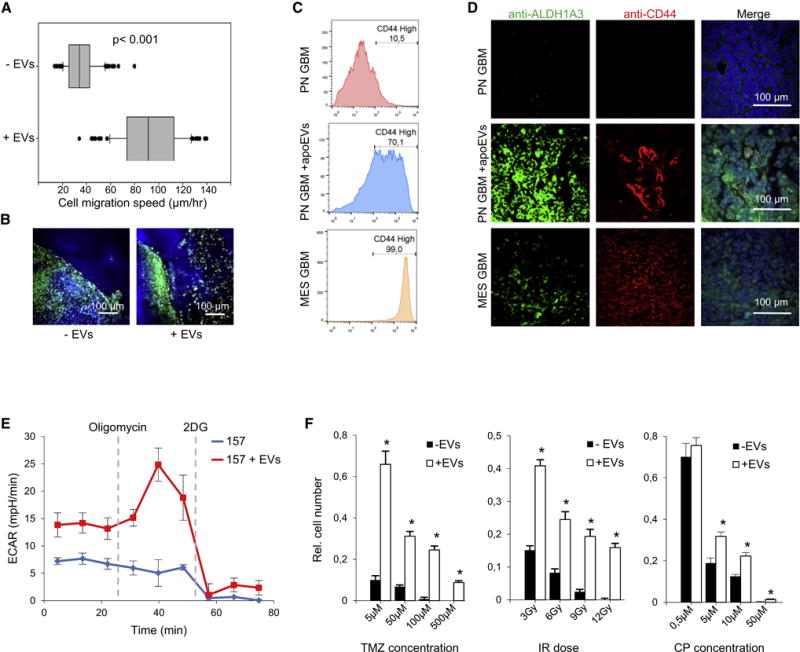
(A) Single cell motility assay of GBM157 cells that were either untreated or pretreated with apoEVs for 4 days. The line in the box is the median, the left and right of the box are the first and third quartiles, and the whiskers extend to 10th and 90th percentiles respectively.
(B) Representative images of mouse brain sections obtained as in “Figure 1I” and stained for human nuclear antigen (green) and DNA (blue) (n = 5 mice per group).
(C) FACS analysis for CD44 staining of control GBM157 spheres (PN) and spheres that were cultivated with apoEVs for 4 days. GBM267 spheres (MES) were used as a positive control.
(D) Representative images of mouse brain sections obtained as in “Figure 1I” and stained for DNA (blue), ALDH1A3 (green), and CD44 (red). Xenograft tumors formed by GBM267 spheres (MES) were used as a positive control (n = 5 mice per group).
(E) Extracellular acidification rate (ECAR) measured by a Seahorse Bioanalyzer in GBM157 cells that were either untreated or pretreated with apoEVs for 4 days
(F) In vitro cell viability assay of GBM157 spheres cultivated with or without apoEVs for 3 days, followed by treatment with indicated concentration of temozolomide, cisplatin or doses of γ-irradiation.
All quantitative data are average ± SD; *p < 0.01; See also Figures S2 and S3.