
Figure 8. Exogenous RBM11 promotes malignancy of recipient tumor cells.
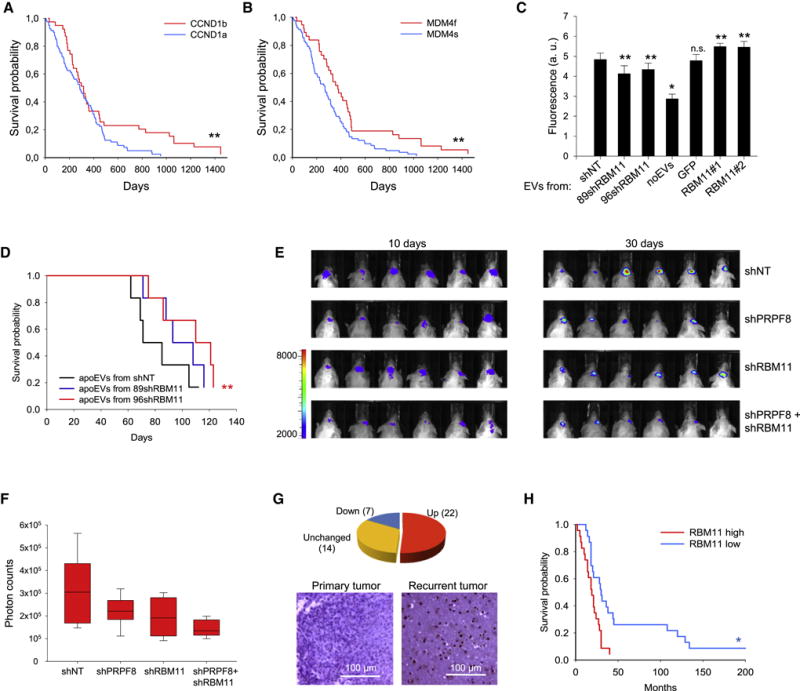
(A, B) Kaplan-Meier curve showing the overall survival of glioma patients subdivided based on the splicing of Cyclin D1 (A, p=0.0392, log-rank test) and MDM4 (B, p=0.0112, log-rank test), RNAseq data were obtained from TCGA database.
(C) In vitro cell growth assay of 157 spheres cultivated for 7 days with apoEVs from different sources: 157 cells stably expressing GFP, GFP-RBM11, two different shRNA against RBM11 or non-target shRNA (NT).
(D) Kaplan-Meier survival curves of mice injected with GBM711 spheres together with apoEVs from GBM711 cells stably expressing shRNA against RBM11 or NT shRNA as a control (n = 6 mice per group, p=0.13 and p=0.04, log-rank test).
(E) Representative bioluminescence images of mice intracranially coinjected with 2·105 luciferase labeled GBM1051 neurospheres and 2·105 lethally-irradiated (12 Gy) unlabeled GBM1051 neurospheres that were previously infected with lentiviruses encoding control shRNA (shNT) or shRNA against RBM11 (shRBM11) and/or shRNA against PRPF8 (shPRPF8).
(F) Quantification of luciferase signal in mice from (E). The horizontal line in the box is the median, the bottom and top of the box are the first and third quartiles, and the whiskers extend to 10th and 90th percentiles respectively.
(G) Analysis of RBM11 immunoreactivity in 43 paired GBM specimens of primary and recurrent tumors from the matched patients (upper) and representative images of immunohistochemical staining for RBM11 (lower).
(H) Kaplan-Meier curve showing the overall survival of glioma patients (n=45) subdivided in two groups based on RBM11 immunoreactivity (p=0.0018, log-rank test), data obtained from the tissue microarray.
All quantitative data are average ± SD; *p < 0.01, **p < 0.05; See also Figure S8.