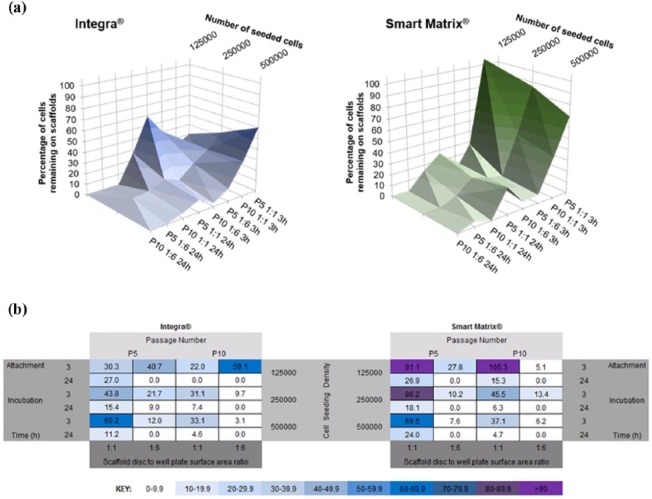
Figure 6.
(a) 3D visual representation of cell seeding efficiency on both dermal scaffolds under the four different variables investigated in this study. Results show average values. (b) Matrix of variables showing how combination of the different variables investigated in this study affects cell seeding efficiency, calculated as percentage of cells remaining on the scaffolds. Values show averages for each individual set of conditions.

