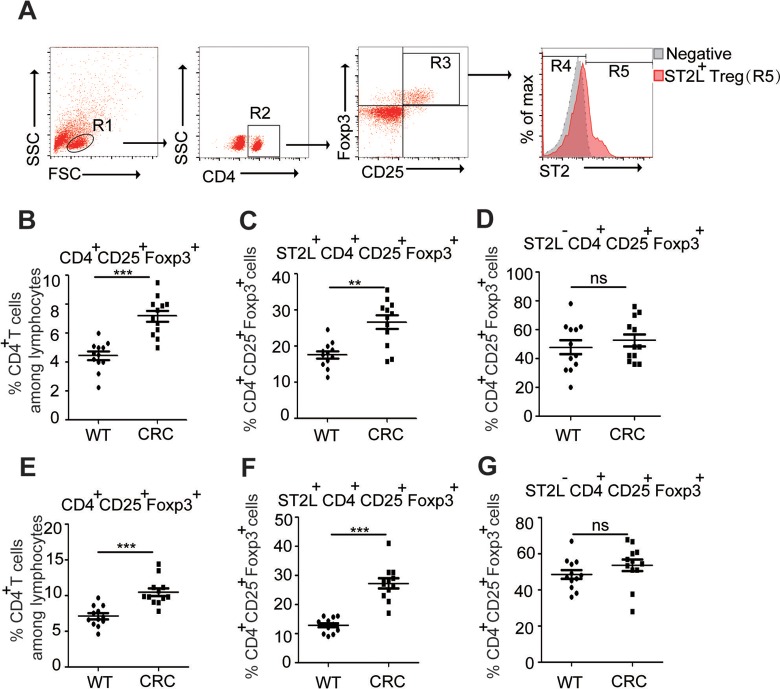
Figure 2.
Enhanced expression of ST2L+Treg cells in CT26 tumor-bearing mice single-cell suspensions of spleens from normal or tumor-bearing mice were prepared. Gating schemes for analysis of the percentages of Treg (R3, gated from R1 and R2) and ST2L+Treg cells (R4, gated from R1, R2, and R3) (A). Cells in the spleen (B-D) or tumor tissues (E-G) were stained with CD4-FITC, ST2L-APC, and CD25-PE-cyanine 7 and then intracellularly stained with PE-conjugated antibodies against Foxp3 for FACS analysis of CD4+CD25+Foxp3+ (Treg) (B, E), ST2L+CD4+CD25+Foxp3+ (ST2L+Treg) (C, F), or ST2L−CD4+CD25+Foxp3+ (ST2L−Treg) (D, G) cells. Data are expressed as the mean (SD) of 12 mice for each group from 2 experiments (Student t test). Treg indicates regulatory T; PE, phycoerythrin; FACS, fluorescence-activated cell sorting; SD, standard deviation.

