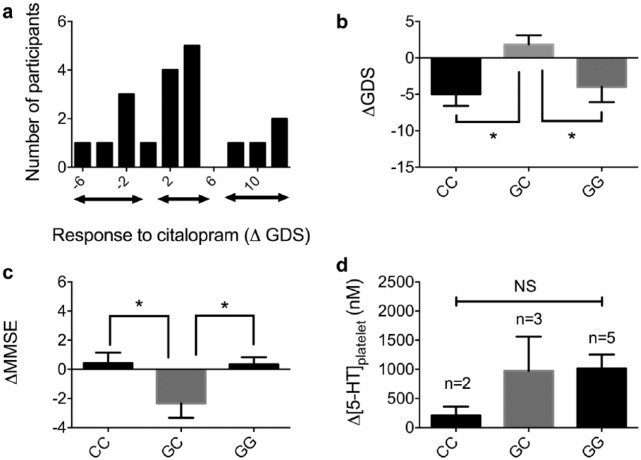
Figure 2.
The relationship between 5-HT1A genotype and response to citalopram.
(a) Histogram demonstrating the distribution of participants’ ΔGDS scores. It appears there are three groups of patients: a group of responders, a group demonstrating no clinical change and a group whose depression score declines; (b) individuals with GC genotype were significantly different to individuals with a CC genotype, in terms of effect on depression score (GDS; n = 19, p = 0.024, one-way ANOVA); (c) individuals with GC genotype showed a significant decrease in cognition over the study period compared with CC and GG genotypes (n = 19, p = 0.035, one-way ANOVA); (d) no statistically significant difference was found between the three genotypes in terms of platelet [5-HT] concentration.
ANOVA, analysis of variance; C, cytosine; G, guanine; GDS, Geriatric Depression Scale; MMSE, Mini Mental State Examination Score.

