. 2018 May 24;9(24):5383–5388. doi: 10.1039/c8sc00484f

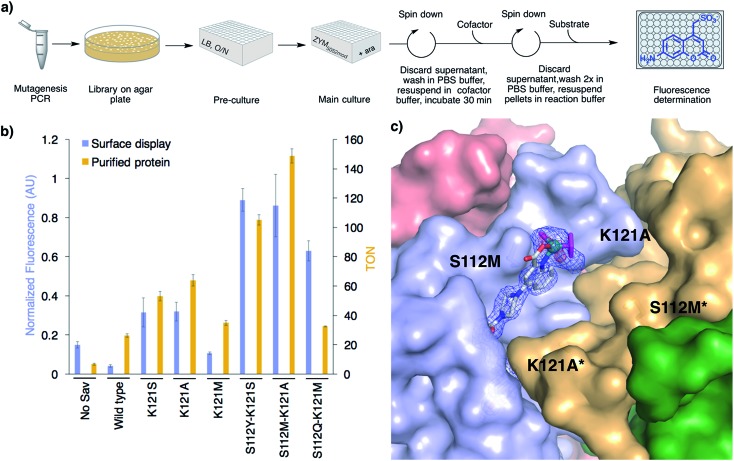
Fig. 3. High-throughput screening on E. coli's surface to optimize ADAse activity. (a) 96-well plate screen. (b) Summary of the results from the directed evolution of ADAses on E. coli's surface (blue bars) and catalysis with purified Sav mutants (gold bars) identified using the surface-display screen. Reaction conditions with purified Sav samples: 500 μM substrate 1, 0.2 mol% cofactor 3, 0.4 mol% Savmonomer, 30 h, RT. (c) Crystal structure of an evolved ADAse [CpRu(QA-Biot)(OH2)] 3·Sav S112M–K121A (PDB ; 6FH8). The protein is displayed as solvent-accessible surface and the cofactor and residues S112M and K121A as stick models. The cofactor 3 is contoured with electron density of a 2FoFc map in blue (1σ) and an anomalous dispersion density in red (4σ). The ruthenium is displayed as a turquoise sphere. The ligands highlighted in magenta were not included in the structure refinement as no electron density could be unambiguously identified. Only one cofactor within the bis-biotin binding vestibule is depicted for clarity.

Fig. 3