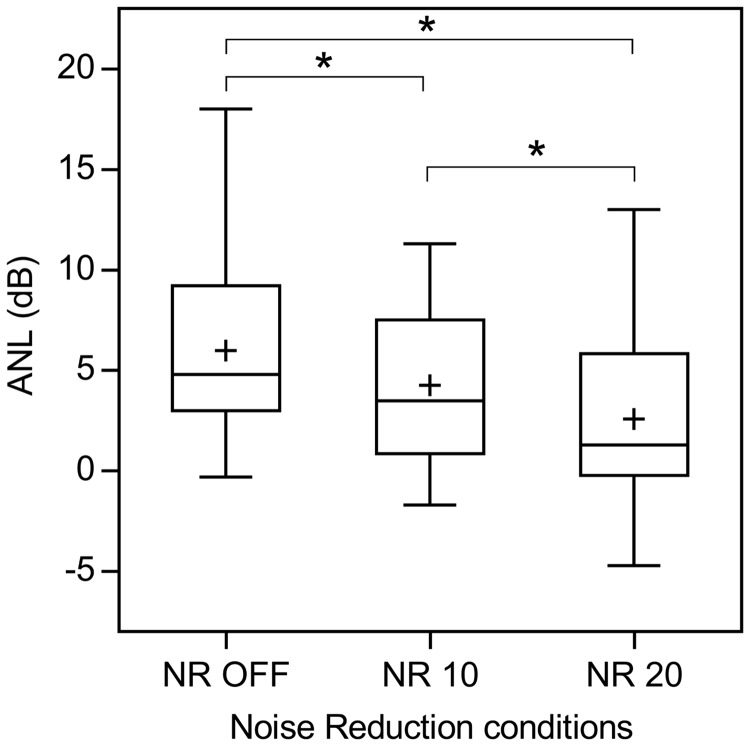
Figure 4.
ANLs in the three NR conditions. The mean is represented by the plus sign. The median is indicated by the vertical line in the center of the box. The interquartile range (i.e., the third quartile minus the first quartile) is represented by the width of the box. Lines extending from the upper and lower edge of the box correspond to the highest and lowest values that are within 1.5 times the interquartile range. *indicates a significant difference in results between the two NR conditions.

