Fig. 1.
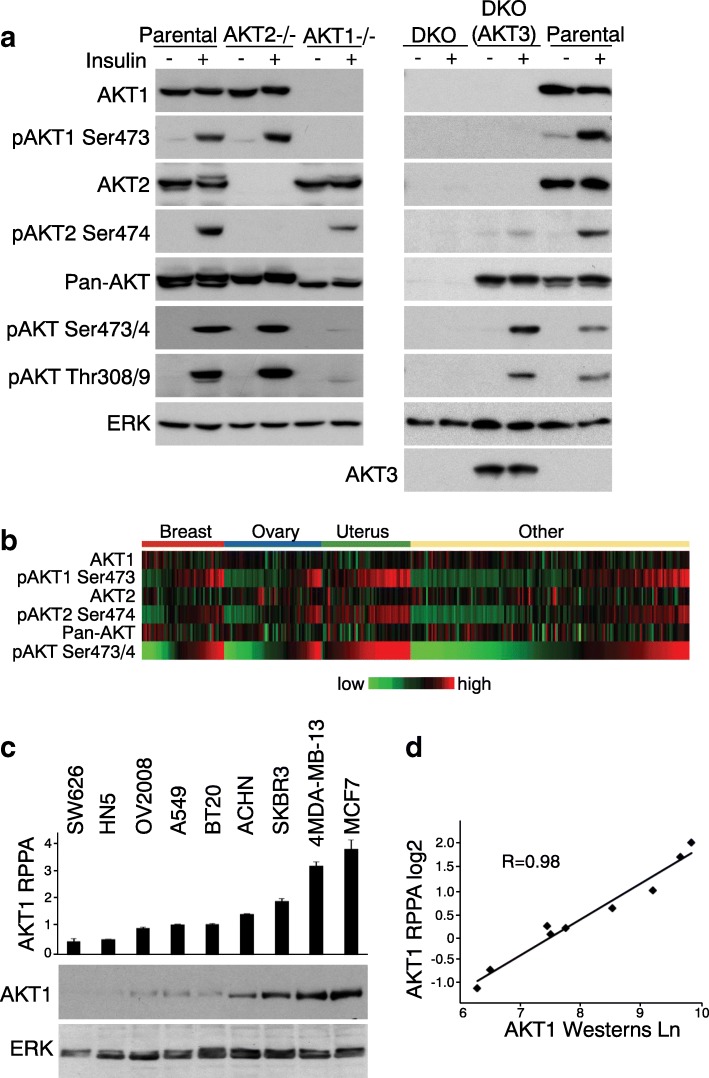
Validation of AKT isoform-specific antibodies a Validation of AKT isoform-specific antibodies by Western blotting. HCT116 parental, AKT2−/−, AKT1−/−, DKO, and DKO transfected with AKT3 cells were serum starved overnight and treated (or not treated) with insulin (20 μg/ml) for 30 min. Cells were lysed in RIPA buffer with protease inhibitors and phosphatase inhibitors. Lysates (50 μg/lane) were resolved in 10% sodium dodecyl sulfate polyacrylamide gel electrophoresis (SDS PAGE). Antibodies for each blot are listed to the left. ERK immunoblotting showed equivalent loading. b Heat map of RPPA features of protein and phospho-protein levels of AKT1, AKT2, and pan-AKT across 211 cell lines. Red, higher expression (relative to median across all cancers); green, lower expression. Cell lines are ordered by low to high pAKT Ser473/4 in each group. c Validation of AKT1 isoform-specific antibody for RPPA. Lysates of 211 cell lines were analyzed by RPPA platform in triplicate using AKT1 antibody. Selected cell lines expressing AKT1 at low to high levels per RPPA data are shown in the bar graph, with standard deviations as error bars. AKT1 levels in the selected cell lines (20 μg total protein/lane) were examined by western blotting. ERK immunoblotting was used as loading indicator. Scanning densitometric values of AKT1 on western blotting were obtained using ImageJ software (version 1.46r; National Institutes of Health, Bethesda, MD). d Correlation coefficient between AKT1 signals derived from RPPA (Y axis) and western blotting (X axis). RPPA data are presented as log2-transformed values. Western data presented as ln-transformed densitometric values

