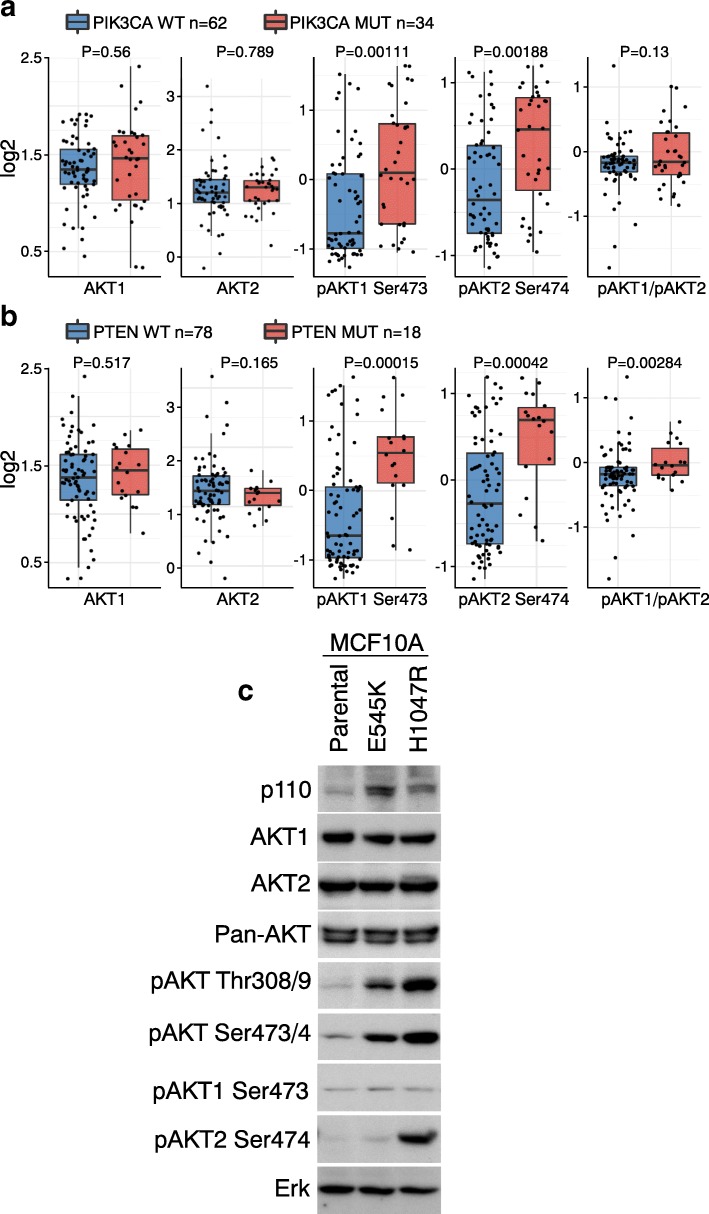
Fig. 4.
AKT isoform-specific activation in different genetic backgrounds a Box plots of protein or phospho-protein levels of AKT1 and AKT2 by status of PIK3CA (wild type [WT] versus mutation [MUT]). P values by t-test on log values. Box plots represent 5, 25, 50, 75, and 95%. b Box plots of protein or phospho-protein levels of AKT1 and AKT2 by status of PTEN. Box plots represent 5, 25, 50, 75, and 95%. c AKT isoform-specific activation by PIK3CA mutations. MCF10A Tet-on cells expressing PIK3CA E545K or H1047R mutations were cultured in complete medium. Cells were lysed in RIPA buffer with protease inhibitors and phosphatase inhibitors. Lysates (50 μg/lane) were resolved in 10% SDS PAGE. Antibodies for each blot are listed to the left. ERK immunoblotting shows equivalent loading

