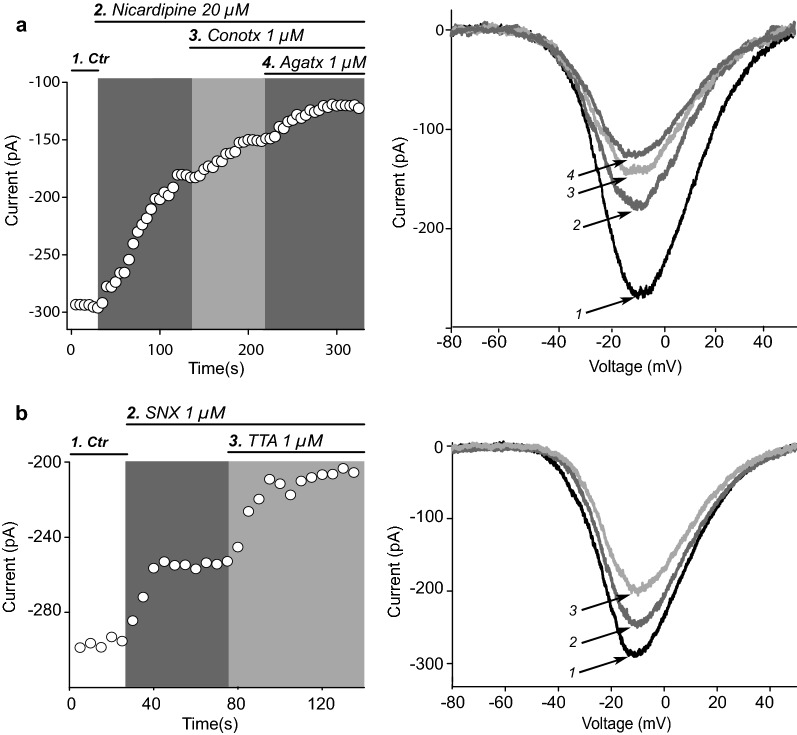
Fig. 2.
Calcium channels expressed in striatal FSI. a Left: representative time course of peak maximum Ca2+ current amplitude during the sequential addition of 20 µM nicardipine, a CaV1 (L) channel antagonist, 1 µM ω-conotoxin GIVA (ω-CgTx), a CaV2.2 (N) channel antagonist, and 1 µM ω-agatoxin TK (ω-AgTx), a CaV2.1 (P/Q) channel antagonist. Right: Representative I–V plots obtained during sequential application of each Ca2+ channel antagonist and the consequent Ca2+ current reduction. Note remaining unblocked current. b Left: Time course of maximum Ca2+ current amplitude showing the action of saturating concentrations of 1 µM SNX-482 (SNX), a CaV2.3 (R) channel antagonist and 1 µM TTA-P2 (TTA), a CaV3 (T) channel antagonist. Right: Representative I–V plots during sequential application of Ca2+ channel antagonists with the consequent Ca2+ current reduction. Average percentage of current reduction in a sample of experiments after each channel antagonist was taken as the contribution of a specific Ca2+ channel class as seen in Table 1

