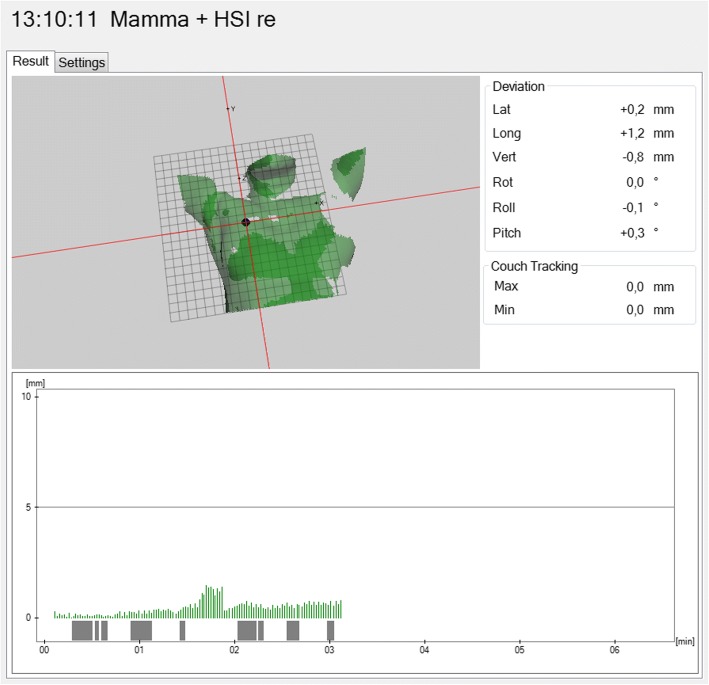
Fig. 2.
Screenshot of the c4D-software showing a patient surface image of a Catalyst scan (isocentre marked as point on the right chest wall); below the image, the measurements during a treatment session are depicted over time. Bars indicate the magnitude of the deviation vector in millimeter, and the bars above the time scale indicate the beam-status (on vs. off)

