
Fig. 1.
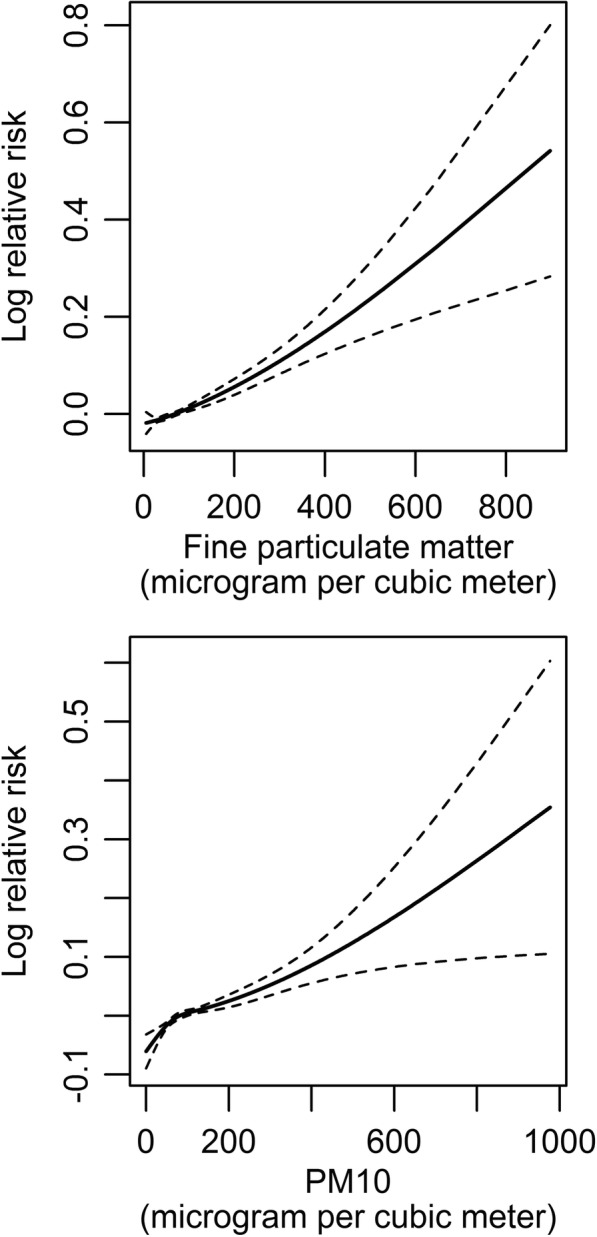
Dose-response relationship between cardiac arrhythmia hospital admissions in 26 Chinese cities and particle matters concentration (degree of freedom = 3). The x-axis of the upper part is the 4-d (lag0–3) moving average concentration of fine particulate matter (μg/m3); the x-axis of the lower part is the 5-d (lag0–4) moving average concentration of PM10 (μg/m3). The y-axis is the predicted log (relative risk) after adjusting for the temperature, relative humidity, public holidays and city-level confounders. The solid lines represent the effect estimates and the dashed lines represent 95% confidence intervals