Fig. 2.

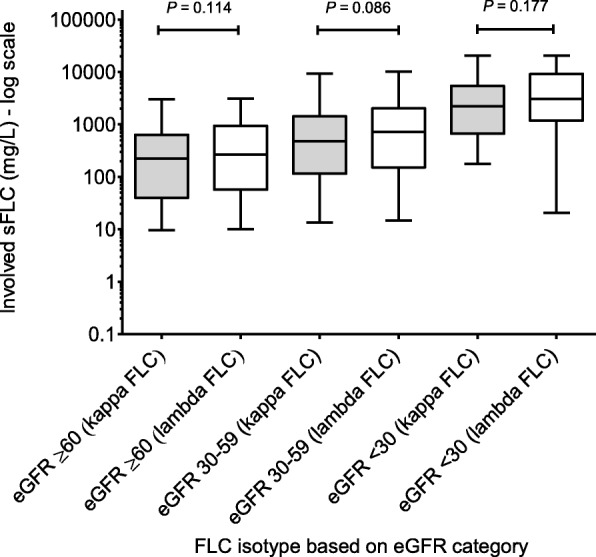
Serum FLC level distribution by eGFR. (showing a progressive rise in serum FLC level with worsening of eGFR category irrespective of the FLC isotype. Data presented as box plot with whiskers and solid line represents median)

Serum FLC level distribution by eGFR. (showing a progressive rise in serum FLC level with worsening of eGFR category irrespective of the FLC isotype. Data presented as box plot with whiskers and solid line represents median)