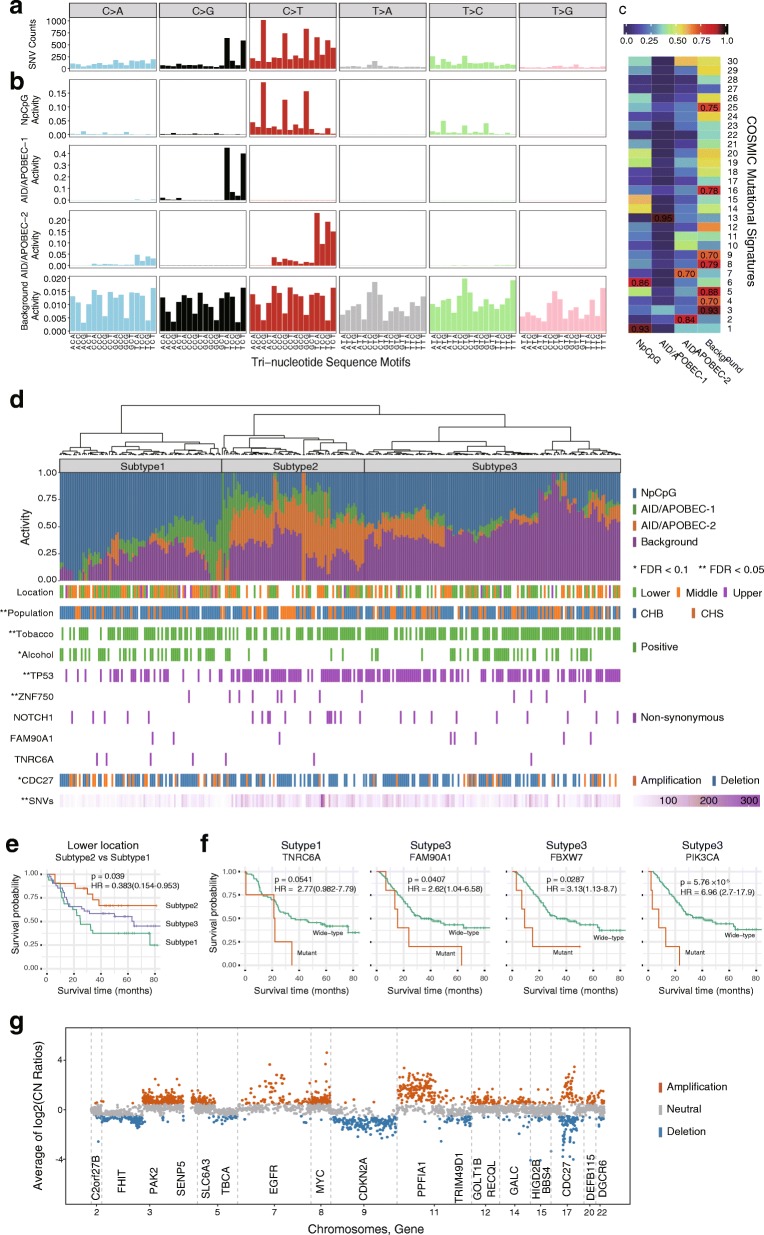
Fig. 1.
Somatic mutational signatures in 302 ESCC. a Frequencies of 96 subtypes of base substitutions of SNV identified from the exomes of 302 ESCC. b Four somatic mutational signatures, “NpCpG”, “AID/APOBEC-1”, “AID/APOBEC-2” and “Background” retrieved from the mutational profiles of SNVs. c Comparison of the four somatic mutational signatures from ESCC with the known mutational signatures (No.1 to 30) in the COSMIC. The similarity measures labeled in the grids are based on “Cosine similarity”. d Subtypes of ESCC based on the clustering of the activities of the mutational signatures of the ESCC samples. The activities of each mutational signatures in each sample are denoted by the colored-bars below the dendrogram. The clinical and molecular features that are significantly associated with the subtypes are labeled beneath the bar plot. e The outcome of the three subtypes of ESCC differ in tumors in lower esophagus. The Kaplan-Meier curves are based on the fraction of overall survival in lower esophagus. The P values and Hazard Ratio (95% confidence interval) are estimated using Cox-regression. f The SMGs are predictive in subtype 1 and 3. Kaplan Meier curves are based on the somatic TNRC6A, FAM90A1, FBXW7 and PIK3CA mutational statuses. The P values and Hazard Ratio (95% confidence interval) are estimated using Cox-regression. g Log2 copy-number ratio of the genomic segments in ESCC. The segments of significant copy number alterations are shown in color (orange: amplification, blue: deletion) with the affected genes labeled beneath. A copy-number amplification was defined if the log2 copy number ratio is above 0.5; and the deletion if the value is below − 0.5

