. 2018 May 29;9(25):5630–5639. doi: 10.1039/c8sc01288a

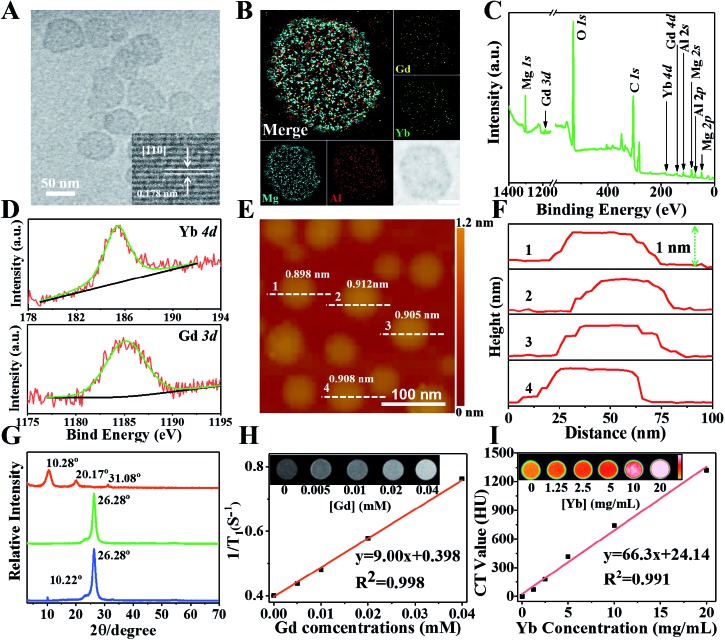
Fig. 1. (A) HRTEM image of monolayer Gd&Yb-LDH. The inset shows the [110] lattice fringe of an LDH phase. (B) EDX mapping of Gd&Yb-LDH monolayer nanosheets. Scale bar, 20 nm. (C) Wide XPS spectra of Gd&Yb-LDH nanosheets and (D) XPS spectra of Gd 3d and Yb 4d. (E) AFM image and (F) measured thickness of the Gd&Yb-LDH monolayer nanosheets. (G) XRD patterns of the bulk LDH sample (blue), the Gd&Yb-LDH monolayer sample (green), and the re-stacked sample of Gd&Yb-LDH monolayers (red). The peak at 26.28° is ascribed to the PET substrate. (H) T1-Weighted relaxivity and MRI images (inset) of the Gd&Yb-LDH monolayer with various Gd concentrations. (I) CT value and CT images (inset) of the Gd&Yb-LDH monolayer with various Yb concentrations.

Fig. 1