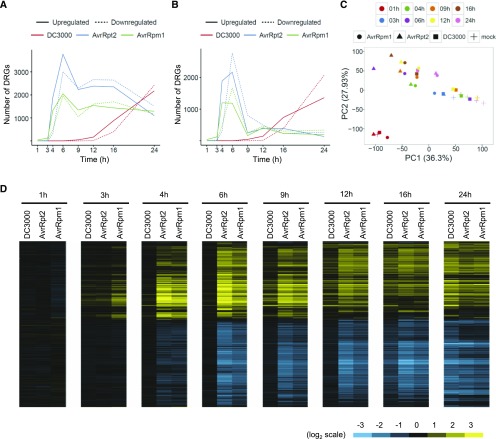
Figure 1.
Transcriptome Dynamics in Col-0 Challenged with Virulent Pto DC3000 or Avirulent Pto AvrRpt2 or AvrRpm1.
(A) and (B) Genes that show significant induction (solid line) or suppression (dotted line) in Pto DC3000- (red line), Pto AvrRpt2- (blue line), or Pto AvrRpm1-treated (green line) Col-0 compared with mock-treated samples were selected (DRGs; q < 0.01, 11,144 genes).
(A) The number of DRGs was plotted at each time point.
(B) DRGs were counted only at the earliest time point of statistically significant expression change.
(C) Principal component analysis of the time-series transcriptome data, based on expression levels of genes that show significant expression changes during infection by Pto strains compared with mock (q < 0.01, 11,144 genes). Different treatments and time points are shown by different shapes and colors, respectively.
(D) Heat maps showing expression patterns of the genes that show significant expression changes during infection by Pto strains compared with mock (q < 0.01 and |log2FC| > 1, 7251 genes). The log2 fold changes relative to mock were subjected to hierarchical clustering. Blue indicates negative values, yellow indicates positive values, and black indicates zero. Pto DC3000, Pto AvrRpt2, and Pto AvrRpm1 are referred to as DC3000, AvrRpt2, and AvrRpm1, respectively.

