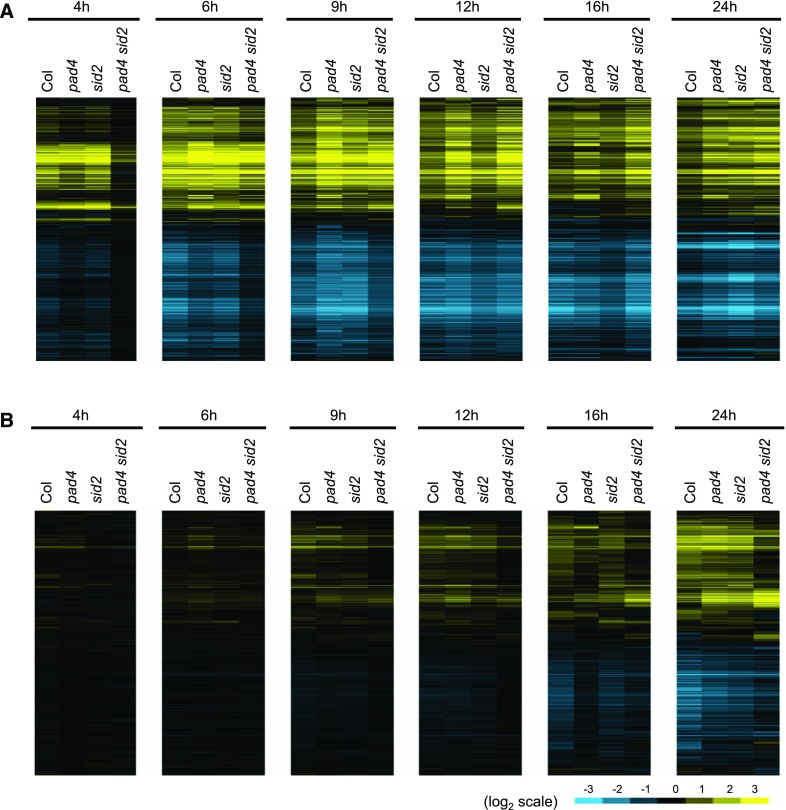
Figure 9.
Comparative Analysis of Transcriptome Dynamics Col-0, pad4, sid2, and pad4 sid2 Challenged with Avirulent Pto AvrRpt2 or Virulent Pto DC3000.
Genes that show significant expression changes in Pto AvrRpt2- or Pto DC3000-treated Col-0, pad4, sid2, and pad4 sid2 compared with mock-treated samples were selected (q < 0.01 and |log2FC| > 1, 10,599 genes). Heat maps show expression patterns of the selected genes. Pto AvrRpt2-responsive genes (A) and Pto DC3000-responsive genes (B). See also the legend of Figure 1D.

