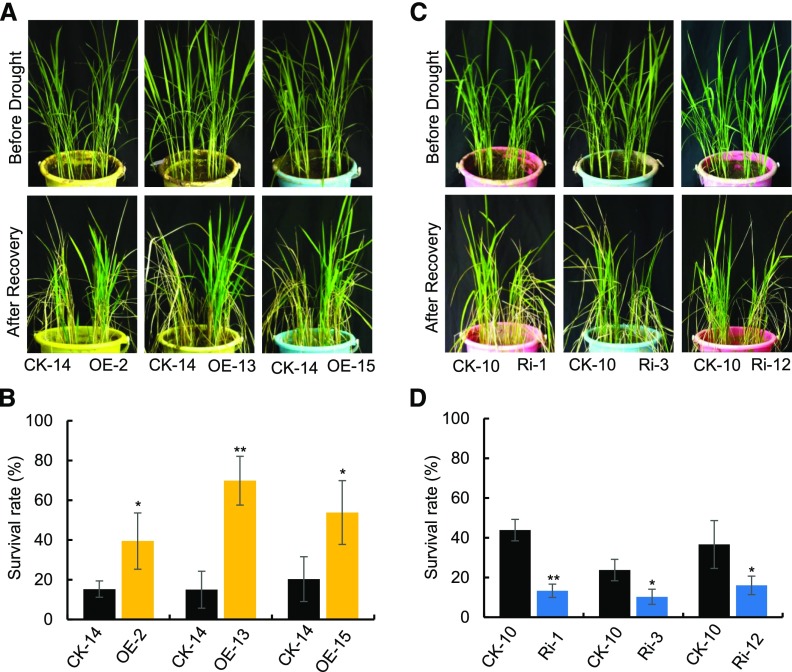
Figure 3.
OsPM1 Regulates Drought Response.
(A) and (B) Phenotypes of OsPM1 overexpression (OE) lines before and after drought.
(C) and (D) Phenotypes of OsPM1-RNAi (Ri) lines before and after drought.
One-month-old plants were drought-stressed as described in Methods. OE plants in (A) were stressed for 14 d along with wild-type control plants (CK-14). Ri plants in (C) were stressed for 10 d along with wild-type control plants (CK-10) since they were more drought sensitive and exhibited phenotype in a shorter stress period. After a recovery period, the plants were photographed. The treatment was performed with at least 40 plants in total for each line. CK, control. OE-2, -13, and -15, three different overexpression lines of OsPM1; Ri-1, -3, and -12, three RNAi lines of OsPM1. In (C) and (D), data are shown as means ± sd for 40 plants from three replicates. Significance of differences between transgenic lines and the corresponding control plants was determined using Student’s t test. *P < 0.05 and **P <0.01 (Supplemental Data Set 2).

