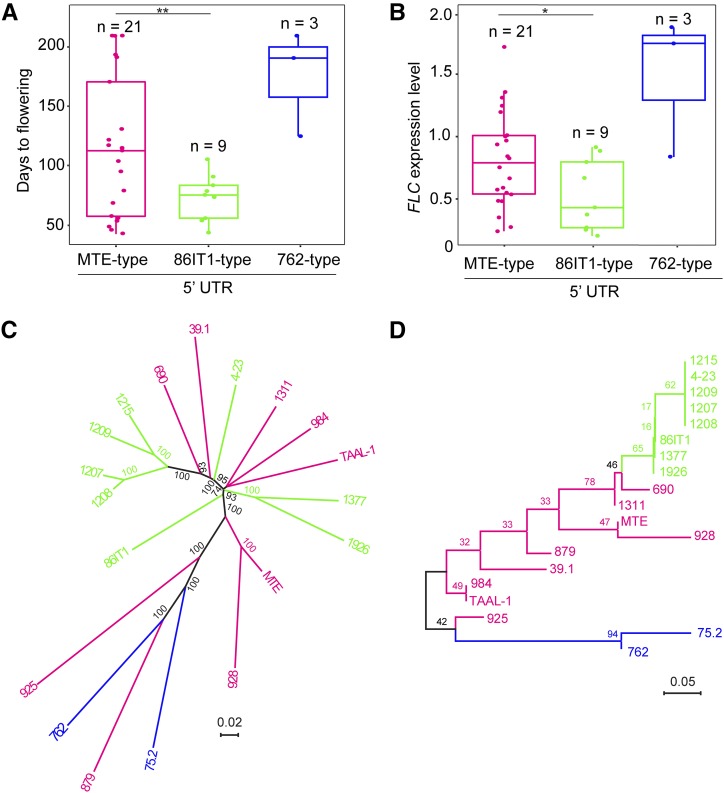
Figure 5.
Parallel Mutations in the Same Region of C. rubella FLC Shape Flowering Time.
(A) and (B) Flowering time and FLC expression levels of C. rubella accessions. Accessions were classified into three different haplotypes based on the promoter sequence at FLC (∼2.7 kb, presence/absence of the 32-bp/54-bp deletion in 5′ UTR). The details about the C. rubella accessions used to provide data for this figure are listed in Supplemental Table 1, except accession 1408, whose early flowering was caused by the splice variation (Guo et al., 2012). Data are plotted for n individuals per haplotype; all of the data points are presented with box plots showing the median, upper, and lower quartiles, and minimum and maximum range values for each haplotype. **P < 0.01 and *P < 0.05 between the 86IT1 and MTE haplotypes (Student’s t test) for flowering time and C. rubella FLC expression level, respectively.
(C) Phylogenetic tree of 19 C. rubella accessions based on whole-genome sequences. Bootstrap values (100 replicates) are indicated at branches.
(D) Phylogeny of FLC alleles of 19 C. rubella accessions based on the FLC full-length fragment (∼9.5 kb). Bootstrap values (1000 replicates) are indicated at branches. Different FLC 5′ UTR haplotypes are indicated by different colors. Orange indicates MTE-type 5′ UTR accessions, green indicates 86IT1-type 5′ UTR accessions, and blue indicates 762-type 5′ UTR accessions. Note that the 86IT1-type and 762-type accessions formed a clade on the phylogenetic tree of FLC alleles but were separated on the phylogenetic tree based on the whole-genome sequences.

