Fig. 4.
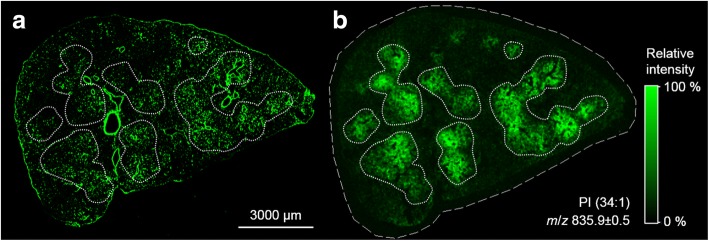
Correlation of nanoparticle distribution and local PI overexpression. Cryo-section 3 d post instillation of SiO2-FITC NPs. a Fluorescence overview image visualizing the principal distribution of NPs mainly located in alveolar macrophages. b MALDI-MS ion image of PI (34:1) ([M-H]−) in a parallel tissue section (bordered by a dashed line). The fine dotted lines demarcate seven main areas of PI overexpression. These areas were transferred to the fluorescence image in (a) to show the co-localization with FITC fluorescence. Large blood vessels and bronchioli show strong autofluorescence, but no PI signal

