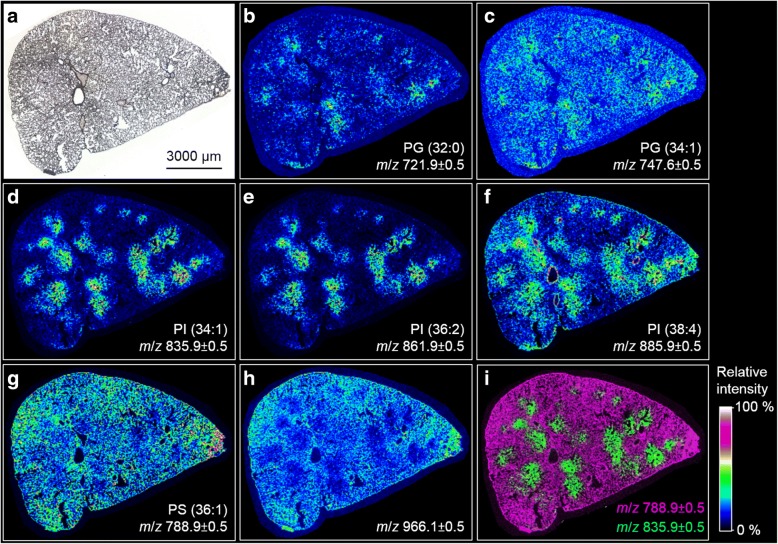
Fig. 5.
MALDI-MS ion images of local changes of lipid concentration in the SiO2-FITC laden rat lung. Cryo-section from an animal 3 d after intratracheal instillation of 0.36 mg SiO2-FITC NPs. a Microscopic image of investigated cryo-section. b, c Ion images indicating a minor local overexpression of PGs. d-f Ion images with pronounced local overexpression of PIs. g, h Ion images of m/z 788.0 ± 0.5 and 966.1 ± 0.5 revealing an inversely correlating distribution of PS and TAG compared to the PIs shown in (d, e) and (f). i Overlay of MS ion images shown in (d and g); m/z are assigned to ion [M-H]−

