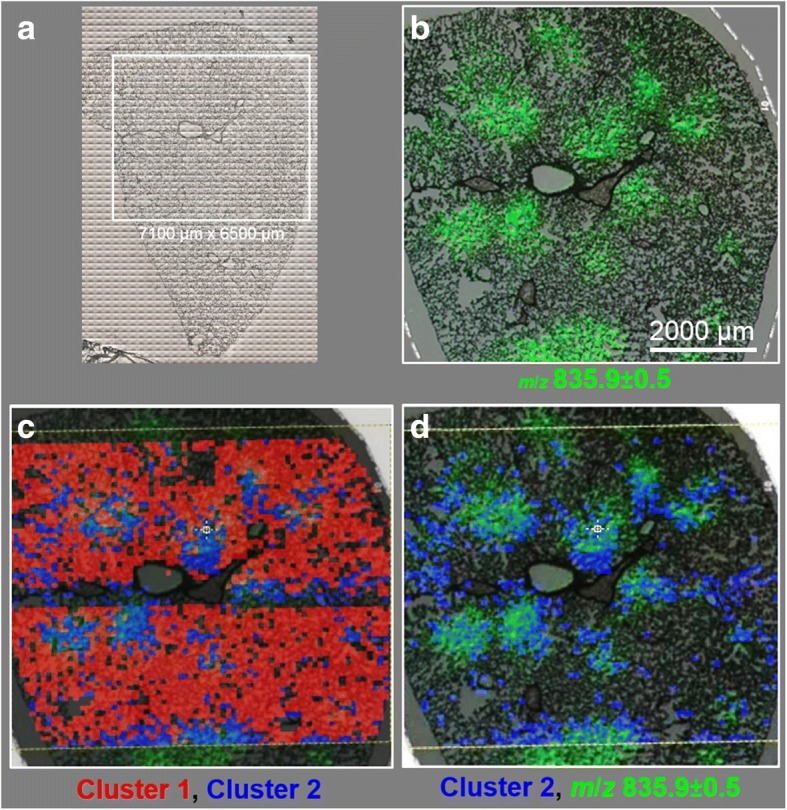
Fig. 8.

Comparison of MALDI-MS imaging with FT-IR spectroscopy followed by add-on hierarchical cluster analysis. a Optical image of lung cryo-section. Region inside the white box was analyzed by means of FT-IR imaging. b Overlay of optical image with MALDI-MS ion image of PI 34:1 of the marked area. c Overlay of (b) with cluster 1 (red) and cluster 2 pixels (blue), as derived from HCA of FT-IR data analysis (Fig. 6). d Overlay of (b) with cluster 2 pixels (blue), indicating that their positions are largely co-located with regions of PI overexpression
