
Figure 6.
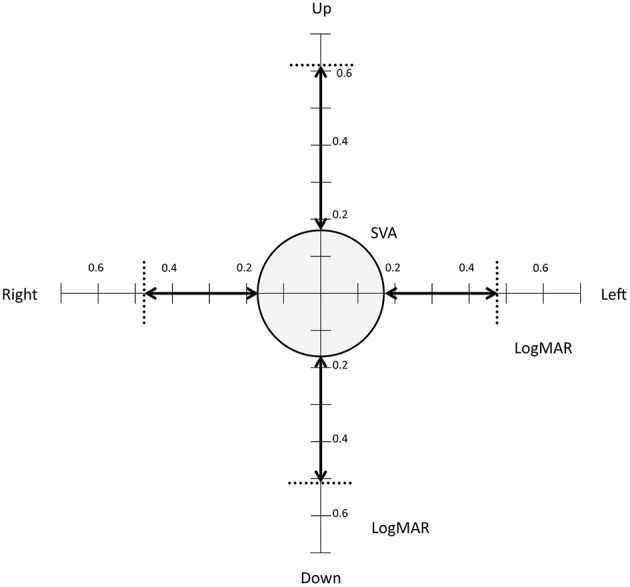
Static and dynamic visual acuity. The circle shows mean static flashed visual acuity (0.17 LogMAR). The dotted lines show mean dynamic visual acuity during head turns to the right, left, up and down. The arrows show loss of Visual Acuity due to head movement in the 4 directions.