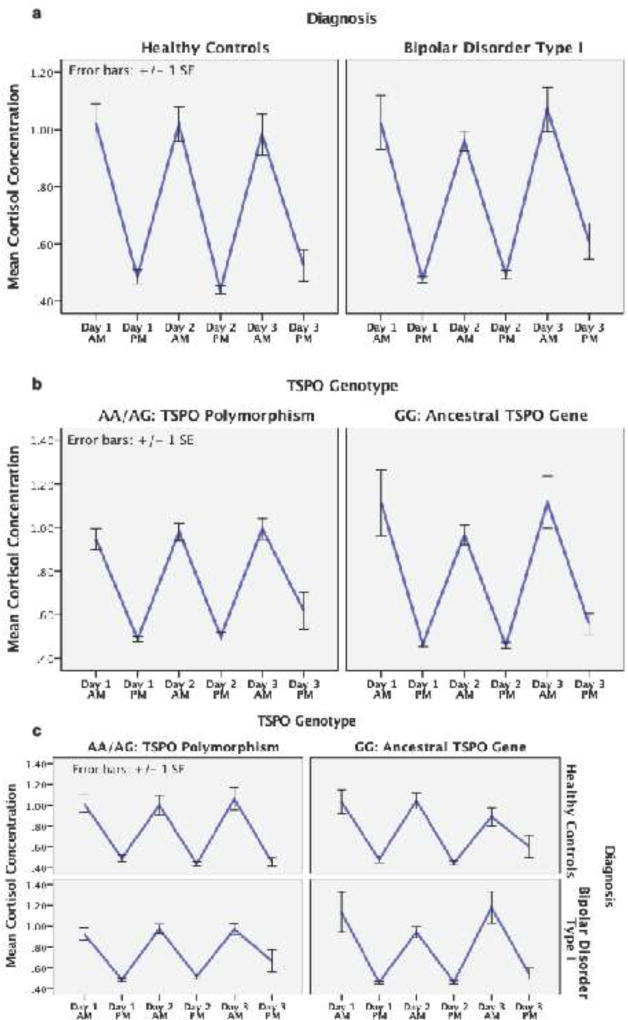
Figure 1.
Figure 1 provides graphical illustration of diurnal cortisol rhythm (also known as cycle) (1 saliva sample in the morning, 1 saliva sample in the evening) on each of 3 consecutive days in study volunteers. Time/Day is represented on the x-axis and mean cortisol concentration on the y-axis. Figure 1a depicts cortisol data in each diagnostic group (i.e. healthy control volunteers on the left, BD-I volunteers on the right). Repeated Measures ANOVA confirmed greater variance in the diurnal cortisol rhythm in BD-I volunteers (F5,525 = 3.0, p = 0.010) compared to healthy volunteers. Figure 1b depicts cortisol data in 2 separate groups based on presence/absence of the TSPO polymorphism. The TSPO polymorphism homo/heterozygotes (AA/AG) on the left and individuals homozygous for the conserved/ancestral allele (GG) on the right. Without considering diagnostic factors, TSPO Genotype did not significantly impact the diurnal cortisol cycle in study volunteers (p > 0.05). Figure 1c depicts cortisol data in 4 separate groups based on presence/absence of BD-I diagnosis and presence/absence of TSPO polymorphism. Healthy controls are depicted in the top row of graphs and BD-I individuals are depicted in the bottom row. Results from individuals with the TSPO polymorphism (AA/AG) (TSPO LAB/MAB) are depicted the left and individuals with the conserved/ancestral allele (GG) (TSPO HAB) are depicted on the right. Presence of TSPOHAB phenotype together with a BD-I diagnosis accounted for significant variance in cortisol’s diurnal cycle (F5,525 = 3.9, p = 0.002).

