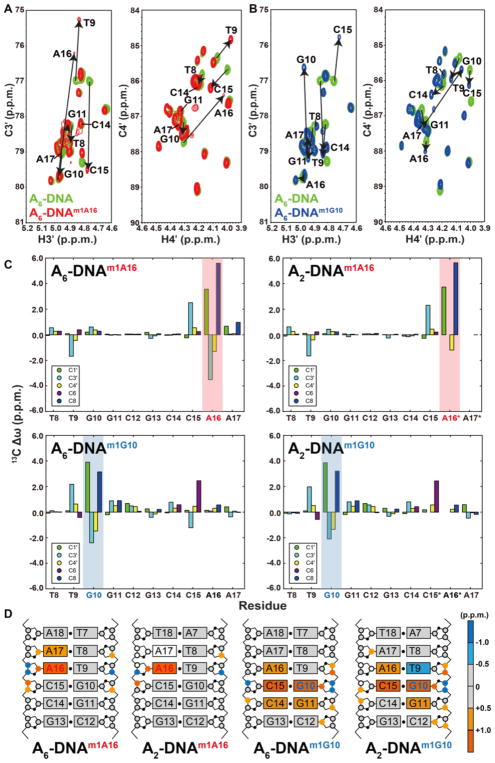
Figure 3. C3′ and C4′ chemical shift perturbations induced by m1A and m1G in duplex DNA.
Overlays of 2D C3′-H3′ and C4′-H4′ HSQC spectra for A6-DNA (green) with (A) A6-DNAm1A16 (red) and (B) A6-DNAm1G10 (blue). Corresponding overlays for A2-DNA are shown in Supplementary Figure 3. (C) 13C chemical shift perturbations induced by m1A and m1G (shade in red and blue, respectively) relative to the unmodified duplex. Star denotes sites that are broadened out of detection. (D) 13C chemical shift perturbations induced by m1A16 or m1G10 highlighted on the structures of A2-DNA and A6-DNA (residues 1 to 6 which experience minor perturbations are not shown for clarity). Colored circles and rectangles represent sites with significant carbon chemical shift perturbations (> 0.5 p.p.m.) on deoxyribose 13C and aromatic 13C, respectively. Open circles on sugars and rectangles on base denote sites that are broadened out of detection.

