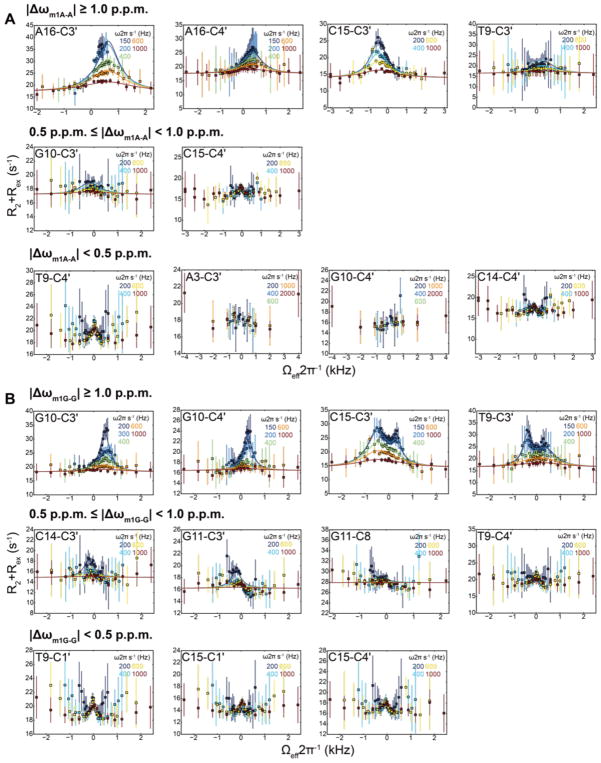
Figure 4. Off-resonance 13C R1ρ RD profiles measured in A6-DNA.
Shown are representative (all other flat RD profiles shown in Supplementary Figure 5) 13C off-resonance R1ρ RD profiles with best global fit of A6-DNA measured at (A) pH 6.8 highlighting A16-T9 Hoogsteen bp exchange and (B) pH 5.4 highlighting both A16-T9 and G10-C+15 Hoogsteen bp exchange at 25 °C. Error bars represent experimental uncertainty (one s.d., see Methods). Also shown are the predicted differences in chemical shifts Δω between Watson-Crick and Hoogsteen based on comparison of chemical shifts measured in the m1A and m1G Hoogsteen stabilizing mutants with their unmodified counterparts. RD is not readily detectable for |Δω| < 0.5 p.p.m whereas it should be observed for |Δω| > 1.0 p.p.m. |Δω| values between 0.5 to 1.0 p.p.m. may or may not lead to detectable RD depending the quality of the data and the exchange parameters.

