
Figure 1. GML reduces T cell adhesion, disrupts actin ring formation, and induces filopodia formation at the plasma membrane.
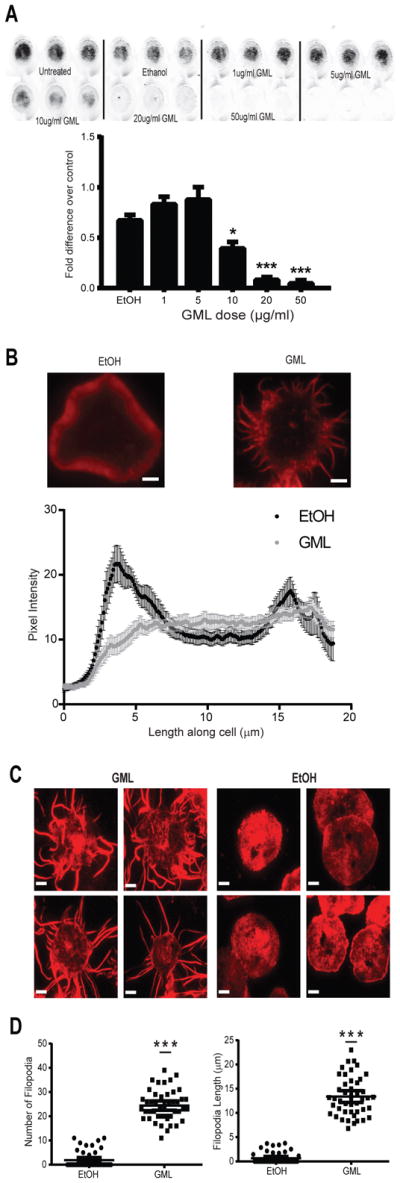
(A) Activated T cells were treated with or without ethanol or the indicated doses of GML, stained with membrane dye, and incubated on anti-CD3 coated plates. Adhesive cells were imaged and quantified using Licor Odyssey software. Top: Images are representative of 4 independent experiments. Bottom: Normalized fluorescence intensity data are means ± SEM. ** denotes p<0.01 and *** denotes p<0.001 by one-way ANOVA with multiple comparisons. (B) Epifluorescence microscopy of activated T cells treated with ethanol or GML that were stimulated with anti-CD3 and stained with TMR-conjugated phalloidin to visualize actin ring formation. Top: Images are representative of 3 independent experiments. Bottom: Pixel intensity data along the long median axis are means ± SEM of 15 cells. Peaks at 4 and 15 μm on the cell axis represent pixel intensity derived from the actin ring. Scale bar, 4 μm. (C) TIRF microscopy of activated T cells restimulated in the presence of either ethanol or GML and stained with TMR-conjugated phalloidin. Images are representative of 3 independent experiments. Scale bar, 4μm. (D) Quantification of the number and length of filopodia per cell in (C). Data are means ± SEM of 60 cells. *** denotes p<0.001 by unpaired t test with Welch’s correction.