
Figure 6. GML causes altered localization of WASp, SLP-76, and ARPC3 microclusters and decreased colocalization of LAT and SLP-76 microclusters.
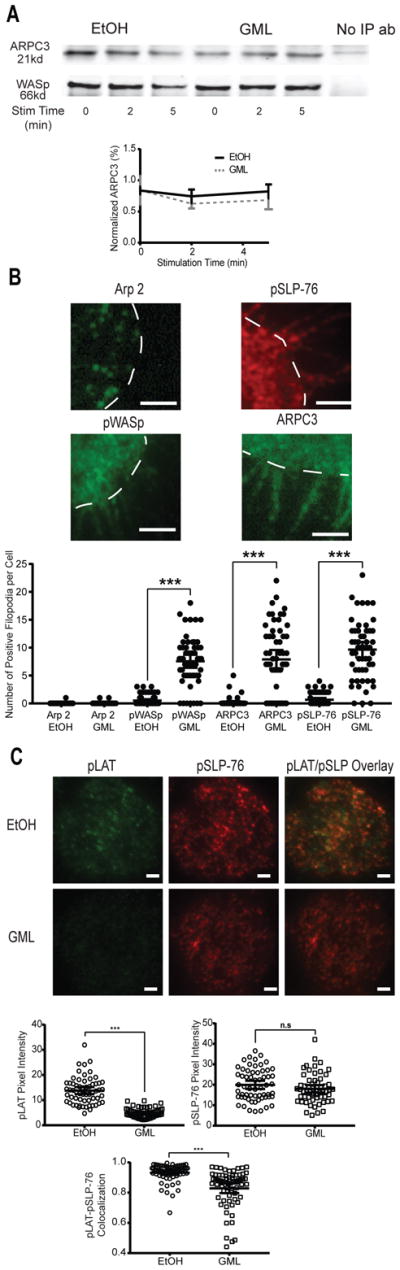
(A) Co-immunoprecipitation analysis of WASp and ARPC3 was performed at the indicated times after stimulation of activated T cells in the presence of ethanol or GML. Top: Western blots are representative of 4 independent experiments. Bottom: Normalized band intensity data are means ± SEM. (B) TIRF microscopy of activated T cells that were restimulated in the presence of ethanol or GML and stained for Arp2, WASp, SLP-76, and ARPC3. Top: Images are representative of GML-treated T cells from 3 independent experiments. White dashed lines outline the cell periphery. Bottom: Number of fluorescent filopodia. Data are means ± SEM of 60 cells. *** denotes p<0.001 by one-way ANOVA with Tukey’s multiple comparisons test. Scale bars, 2 μm. (C) TIRF microscopy of activated T cells that were restimulated in the presence of ethanol or GML and stained for phosphorylated LAT and phosphorylated SLP-76. Top: Images are representative of 2 independent experiments. Bottom: Pixel intensity and co-localization data are means ± SEM of 60 cells. Scale bars, 4 μm. *** indicates p<0.001 by unpaired t test with Welch’s correction.