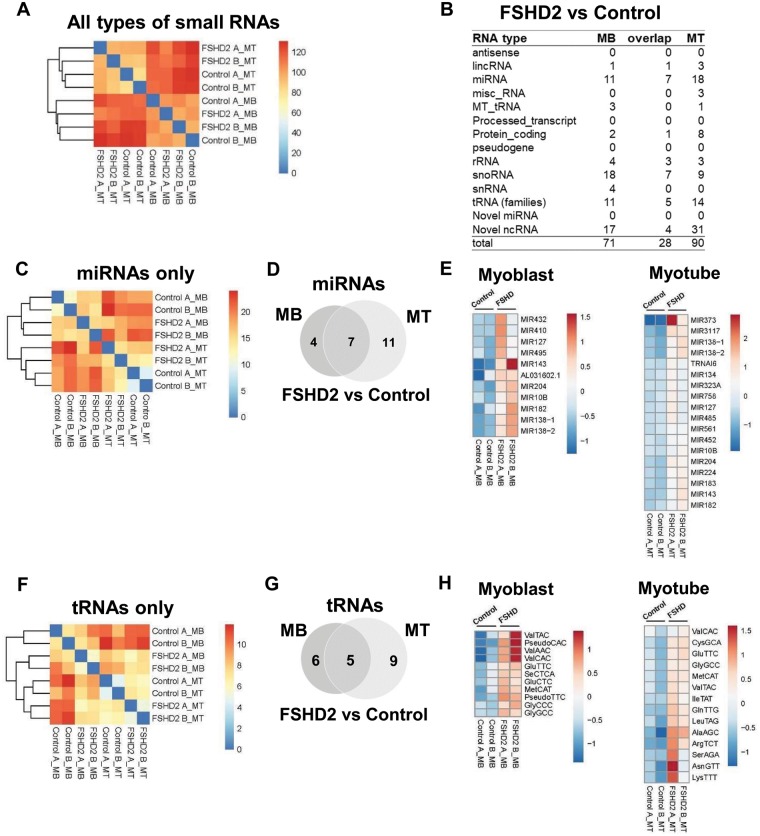
Figure 2.
Small RNAs differentially expressed in FSHD2 cells (FSHD2 versus Control). (A) Unbiased hierarchical analysis for all types of small RNAs revealed two major clusters corresponding to MB and MT samples with FSHD2 samples grouped separately from the control samples within the major MB and MT clusters. (B) Small RNAs differentially expressed in FSHD2 samples in comparison to controls identified by the DESeq2 analysis performed on all types of small RNAs (Padj < 0.05) (Supplementary Material, Table S2). miRNAs, tRNAs and novel noncoding RNAs (ncRNAs) were the major types of FSHD2-specific small RNAs. (C) Unbiased hierarchical clustering analysis for miRNAs only. (D and E) The Venn diagram and heatmaps show 11 known miRNAs differentially expressed in FSHD2 MB compared to controls and 18 known miRNAs differentially expressed in FSHD2 MT compared to controls. About 7 miRNAs were differentially expressed in both FSHD2 MB and MT. (F) Unbiased hierarchical clustering analysis for tRNAs only. (G and H) The Venn diagram and heatmaps show 11 tRNAs differentially expressed in FSHD2 MB compared to controls and 14 tRNAs—in FSHD2 MT compared to controls (5 FSHD2-specific tRNAs overlapped between MB and MT).

