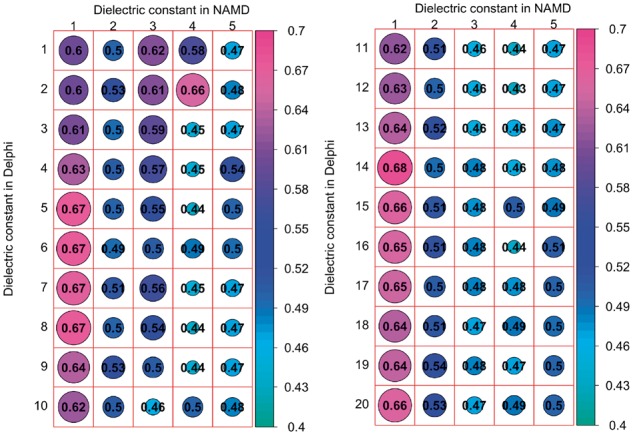
Fig 2.

The correlation coefficient calculated with various dielectric constants used in Delphi and NAMD. The left panel shows the dependence of correlation coefficient when dielectric constant was varied from 1 to 5 in NAMD and 1 to 10 in Delphi, while the right panel shows the same for dielectric constant varied from 1 to 5 in NAMD and 11 to 20 in Delphi. The size of the circles are proportional to the magnitude of the correlation coefficient which is also indicated by the corresponding color (see the color scheme of the right)
