
Fig. 4.
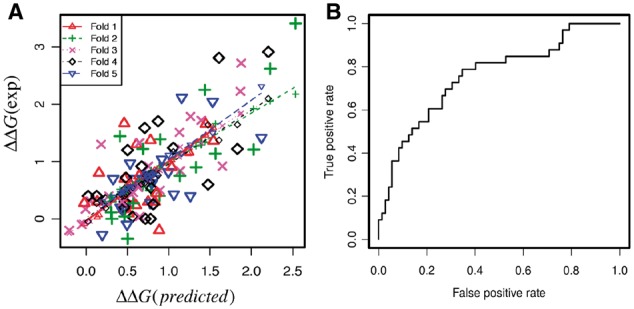
(A) Plot of predicted ΔΔG and experimental ΔΔG in 5-fold cross validation (see Table 3 for details). (B) Receiver operating characteristic curve of classification of large effects (|ΔΔG| > 1 kcal/mol) and small effects (|ΔΔG| < 1 kcal/mol)
Official websites use .gov
A
.gov website belongs to an official
government organization in the United States.
Secure .gov websites use HTTPS
A lock (
) or https:// means you've safely
connected to the .gov website. Share sensitive
information only on official, secure websites.
(A) Plot of predicted ΔΔG and experimental ΔΔG in 5-fold cross validation (see Table 3 for details). (B) Receiver operating characteristic curve of classification of large effects (|ΔΔG| > 1 kcal/mol) and small effects (|ΔΔG| < 1 kcal/mol)