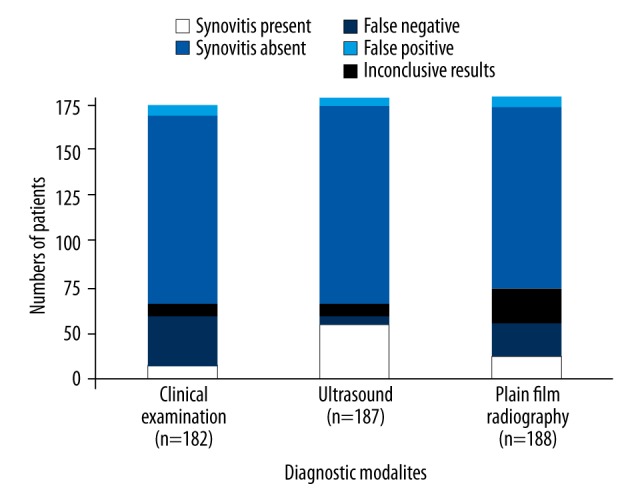
Figure 2.

Comparison between the predictive values of the diagnostic modalities used in the study. The p-values and q-values of the comparison of clinical laboratory investigations with ultrasound imaging were 0.00015 and 4.548. The p-values and q-values of the comparison of plain film radiography with ultrasound imaging were 0.0002 and 4.537. One-way analysis of variance (ANOVA), following Tukey’s post hoc range test, were used for statistical analysis. Values of p<0.01 and q>4.143 were considered to be statistically significant.
