
Fig. 1.
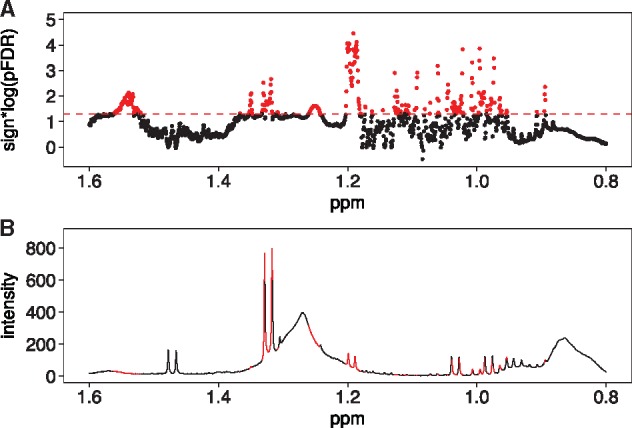
Visualization of the associations of T2D with plasma 1 H NMR metabolites in the FGENTCARD cohort (n = 506). The associations were computed using logistic regression adjusted for age, gender and body mass index. (A) Partial skyline plot (δ 0.80–1.60) showing the −log10 (pFDR) × sign of beta coefficient of each NMR signal. Statistically significant signals positively associated with T2D were colored in red. (B) NMR spectrum (δ 0.80–1.60) of a QC sample colored based on association results (Color version of this figure is available at Bioinformatics online.)