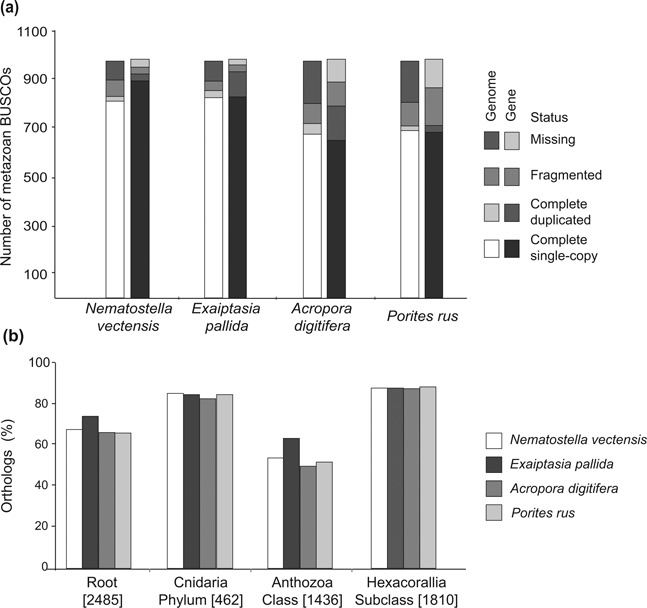
Figure 3:

Completeness assessment of four cnidarian genomes. (a) Bar plots represent the number of metazoan BUSCOs at the genome and gene dataset levels in the sea anemones N. vectensis and E. pallida and the stony corals A. digitifera and P. rus. (b) Percentage of orthologs found in each genome assembly at different taxonomic levels. The numbers in square brackets represent the total number of orthologs reported in the original dataset.
