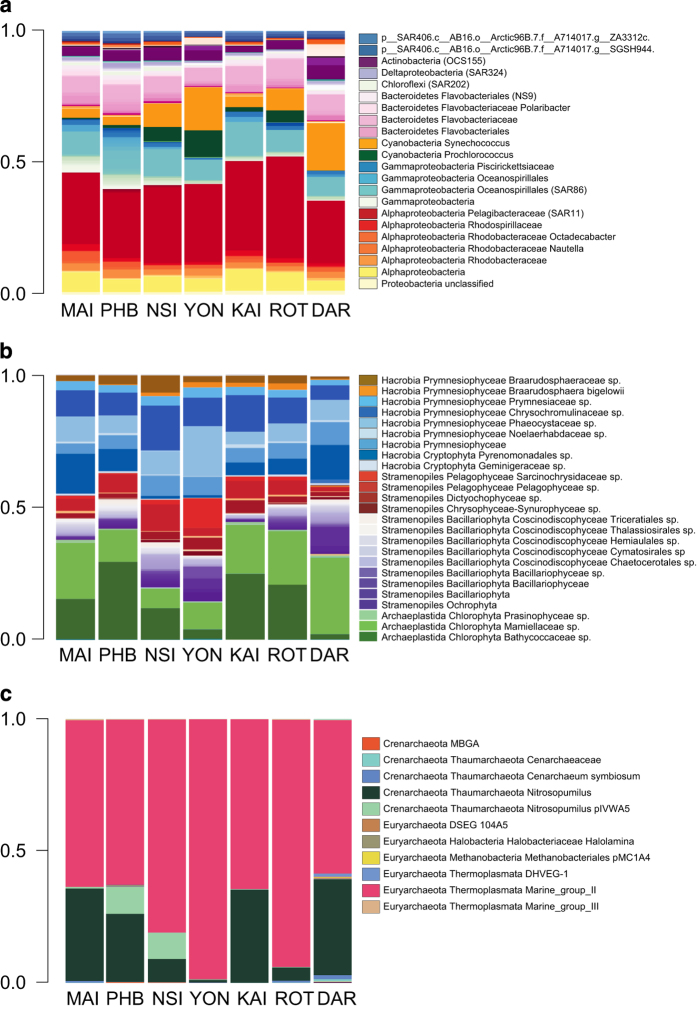
Figure 2. A molecular overview of microbial assemblages retrieved from surface waters at seven IMOS NRS around Australia.
Profiles display the relative abundance of a) bacterial, b) plastid and c) archaeal taxa contributing to>0.1% of combined 16 S rRNA reads in samples collected at 0 m and 10 m depths over the course of the study. One two litre sample per depth was collected during each NRS sample trip (except Darwin where three samples per depth were taken at three hour intervals on two of the quarterly trips) and one DNA extraction and amplicon PCR performed per sample (MAI n= 81, PHB=87, NSI=90, YON=21, KAI=10, ROT=20, DAR=21). For this analysis, bacterial and archaeal taxonomic assignments were made using the GreenGenes database30 (release 13.5) and reads corresponding to chloroplast sequences were removed from the bacterial dataset and analysed independently with taxonomy assigned using the PhytoRef database based on 6,490 plastid 16 S rRNA gene sequences. Scripts used to generate Figs. 2 and 3 are available on Github at https://github.com/martinostrowski/marinemicrobes.

