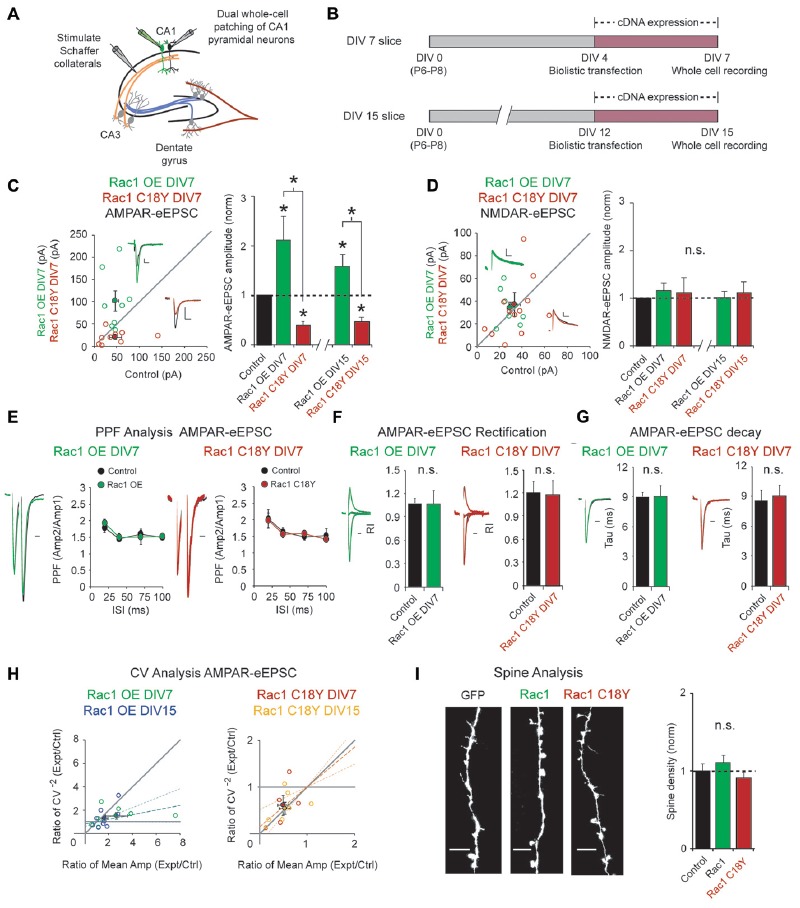
Figure 2.

Rac1 C18Y weakens glutamatergic synaptic transmission. (A) Electrophysiology recording setup. (B) Timeline of transfection and recording. (C,D) Scatterplots show eEPSC amplitudes recorded at DIV7 for single pairs of CA1 pyramidal neurons transfected with Rac1 (green) or Rac1 C18Y (red) and their corresponding control neurons (open circles). Filled circles show mean ± SEM (insets). Current traces from control (black) and transfected (green for Rac1, red for Rac1 C18Y) neurons are shown (Scale bars: 20 ms for AMPA, 50 ms for NMDA, 20 pA). Bar graphs show the average eEPSC amplitudes (± SEM) of neurons expressing Rac1 or Rac1 C18Y normalized to their respective average control eEPSC amplitudes at DIV7 and DIV15. Wilcoxon Rank Sum Tests were used to compare across independent conditions (i.e., Rac1 and Rac1 C18Y in C, *P < 0.05). (C) Rac1 expression increased AMPAR-eEPSC amplitude in DIV7 (n = 8 pairs, *P < 0.05) and DIV15 slices (n = 9 pairs, *P < 0.05). Rac1 C18Y expression reduced AMPAR-eEPSC amplitude in DIV7 (n = 9 pairs, *P < 0.05) and DIV15 slices (n = 7 pairs, *P < 0.05). Significance was determined by Wilcoxon Signed Rank Tests. (D) Rac1 and Rac1 C18Y expression did not affect NMDAR-eEPSC amplitude in DIV7 (Rac1: n = 9 pairs, P > 0.05, Rac1 C18Y: n = 12 pairs, P > 0.05, Wilcoxon Signed Rank Test) or in DIV15 slices (Rac1: n = 9 pairs, P > 0.05, Rac1 C18Y: n = 7 pairs, P > 0.05, Wilcoxon Signed Rank Test). n.s., not significant. (E) Rac1 and Rac1 C18Y expression did not affect paired-pulse facilitation (PPF) ratios at interstimulus intervals of 20, 40, 70 and 100 ms (Left plot: 20 ms: n = 7 pairs, 40 ms: n = 5 pairs, 70 and 100 ms: n = 6 pairs, P > 0.05, Student’s t-test; Right plot: 20 ms: n = 7 pairs, 40 ms: n = 8 pairs, 70 ms: n = 5 pairs, 100 ms: n = 6 pairs, P > 0.05, Student’s t-test). Peak 1-scaled current traces from control (black) and transfected (green for Rac1, red for Rac1 C18Y) neurons are shown. (Scale bar: 20 ms). n.s., not significant. (F) Rac1 and Rac1 C18Y expression did not change AMPAR-eEPSC rectification. Bar graphs show mean ± SEM of the AMPAR-eEPSC rectification index recorded in the presence of AP5. (Left graph: control: n = 5, Rac1: n = 5, p > 0.05, Wilcoxon Signed Rank Test; Right graph: control: n = 7, Rac1 C18Y: n = 6, p > 0.05, Wilcoxon Signed Rank Test). Representative traces (green for Rac1, red for Rac1 C18Y) are shown to the left of graph (Scale bars: 20 ms). (G) Rac1 and Rac1 C18Y expression did not affect AMPAR-eEPSC decay. Bar graphs show mean ± SEM of the AMPAR-eEPSC decay kinetics. (Left graph: n = 8, p > 0.05, Wilcoxon Signed Rank Test; Right graph: n = 7, p > 0.05, Wilcoxon Signed Rank Test). Representative traces (green for Rac1, red for Rac1 C18Y) are shown to the left of graphs (Scale bars: 20 ms). (H) Coefficient of variation (CV) analysis of AMPAR-eEPSCs from pairs of control and Rac1/Rac1 C18Y neurons at DIV7 and DIV15. CV−2 ratios are graphed against the mean amplitude ratio for each pair (open circles; green for Rac1 DIV7: n = 7 pairs; blue for Rac1 DIV15: n = 9 pairs; red for Rac1 C18Y DIV7: n = 5 pairs; yellow for Rac1 C18Y DIV15: n = 7 pairs). Filled circles show mean ± SEM. Dashed lines show linear regression and 95% confidence intervals. (I) Rac1 and Rac1 C18Y expression did not affect spine density. Representative dendritic spine images from neurons transfected with GFP (control), Rac1 or Rac1b C18Y are shown on the left (Scale bars: 5 μm). The bar graph shows average spine density (mean ± SEM) of neurons expressing Rac1 or Rac1 C18Y normalized to GFP expressing control neurons (control: 0.28 ± 0.024 spines/μM, n = 8, Rac1: 0.31 ± 0.024 spines/μM, n = 11, Rac1 C18Y: 0.26 ± 0.021 spines/μM, n = 16, P > 0.05, Student’s t-test).
